


Apollo Energy publishes a daily energy market analysis, focusing on the gas, power and oil markets including a commentary on how the markets close and open. Our analysis provides insight on how the markets are performing and also considers various factors which could dictate price changes in the future.
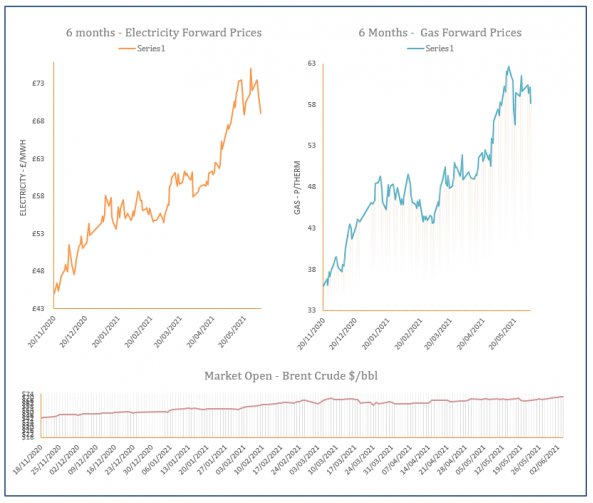
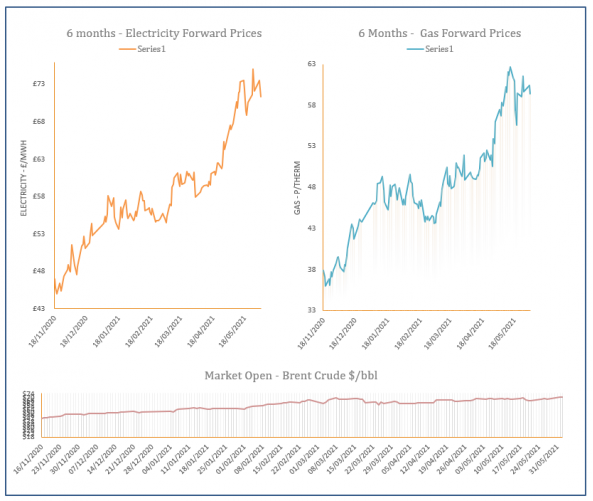
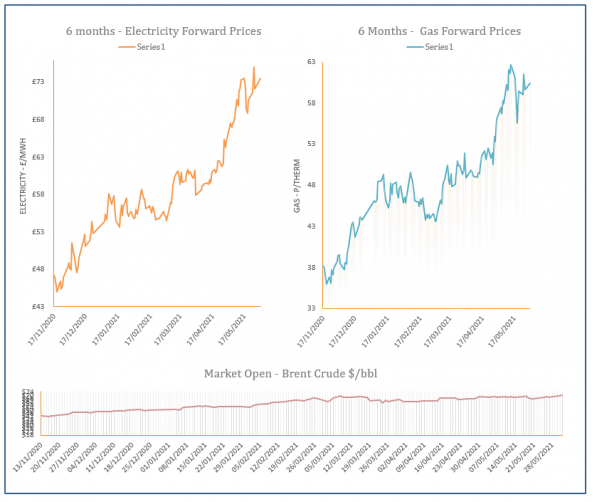
The analysis also contains a graph which tracks the one-year forward price of both gas and electricity as well as changes to Brent crude oil.
Energy Market Analysis – 04-06-2021
4th June 2021 | Posted by: Daniel Birkett | Market Analysis
An improved outlook for UK and European storage levels, combined with another drop on carbon markets has contributed to losses across the gas curve this morning.

Energy Market Analysis – 03-06-2021
3rd June 2021 | Posted by: Daniel Birkett | Market Analysis
Gas prices ended the session lower as warm weather reduced demand and the system was oversupplied despite limited imports. A drop in carbon also helped towards the losses.
Energy Market Analysis – 02-06-2021
2nd June 2021 | Posted by: Daniel Birkett | Market Analysis
Gas prices inched higher during Tuesday’s session despite weak demand as annual maintenance at production facilities and unseasonably low storage levels offered support. Bullish commodities also helped towards gains at the back of the curve.
Energy Market Analysis – 01-06-2021
1st June 2021 | Posted by: Daniel Birkett | Market Analysis
A warm weather forecast and the expected delivery of 4 LNG cargoes over the Bank Holiday weekend helped to weigh on gas prices during Friday’s session. However, rising oil helped to limit losses further along the curve.