


Apollo Energy publishes a daily energy market analysis, focusing on the gas, power and oil markets including a commentary on how the markets close and open. Our analysis provides insight on how the markets are performing and also considers various factors which could dictate price changes in the future.
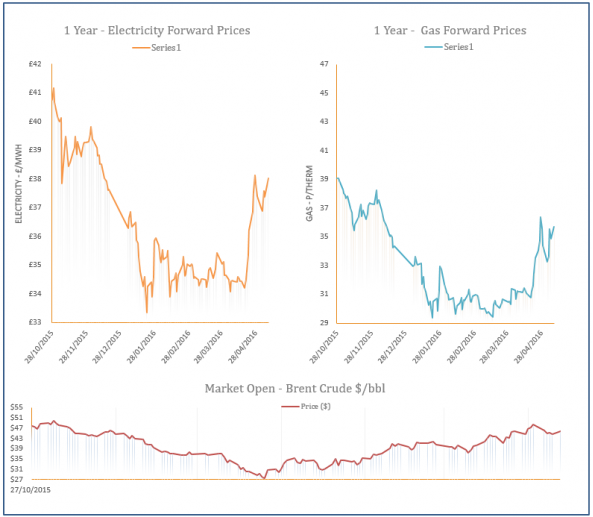
The analysis also contains a graph which tracks the one-year forward price of both gas and electricity as well as changes to Brent crude oil.
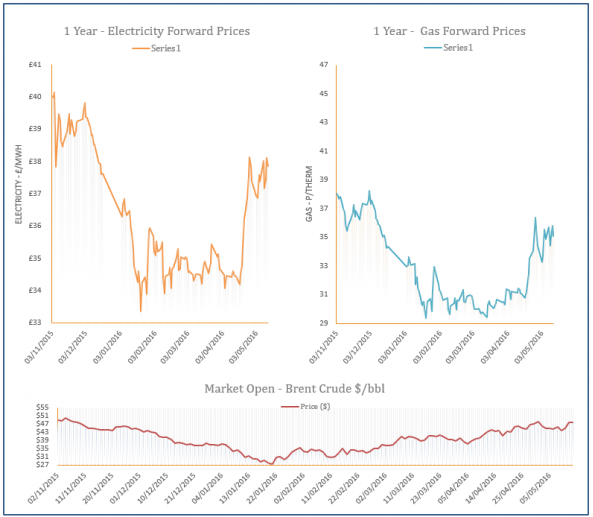
Energy Market Analysis - 13-05-2016
13th May 2016 | Posted by: Daniel Birkett | Market Analysis
Gas prices moved down yesterday afternoon as Norwegian flows into the UK recovered following a weak opening which supported near-curve contracts early in the session. Higher exports to Belgium also contributed to an undersupplied gas system but an improvement in supply levels helped it move closer to balance before the end of the session. Meanwhile, a drop in oil prices helped to weigh on prices further along the curve, erasing the morning’s gains.
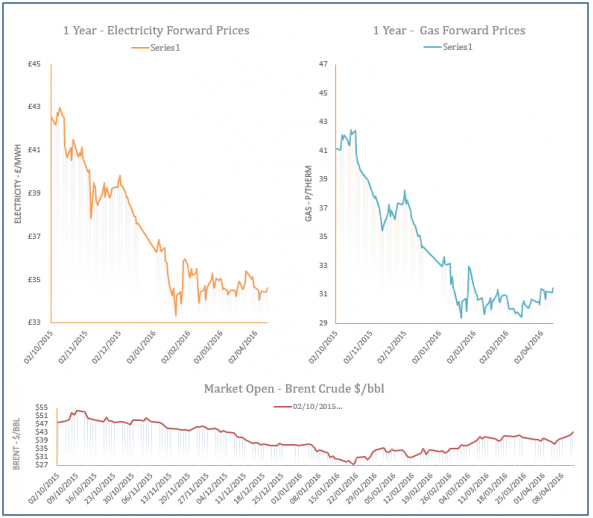
Energy Market Analysis - 12-05-2016
12th May 2016 | Posted by: Daniel Birkett | Market Analysis
Outages at Norwegian and UKCS gas fields limited supply levels in the UK yesterday which provided support across the near curve on Wednesday. Norwegian flows fell by 15% despite the return of the Nyhamna processing plant, while UKCS flows via the Bacton terminal decreased due to maintenance. An increase in exports to Belgium also lifted demand levels above the seasonal norm despite warm weather reducing residential consumption. Meanwhile, prices further along the curve were dictated by stronger oil contracts following the release of the latest EIA report.
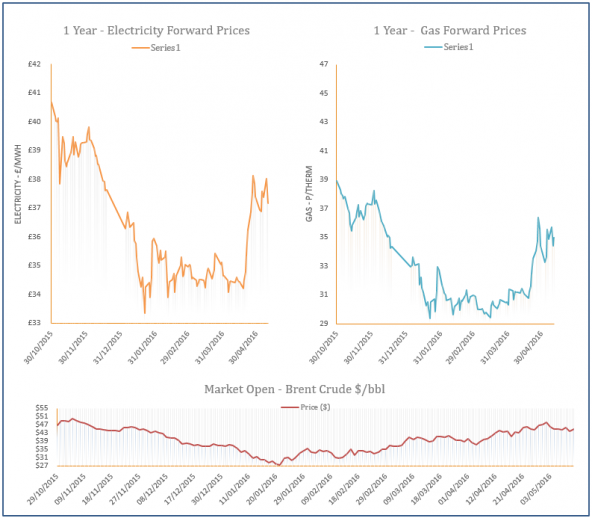
Energy Market Analysis - 11-05-2016
11th May 2016 | Posted by: Daniel Birkett | Market Analysis
Near-curve gas contracts posted losses on Tuesday as the UK gas system was oversupplied throughout the session, however, rising oil prices limited downward movement on the far-curve. Norwegian flows via the Langeled pipeline increased as a number of outages were resolved, although capacity at the Nyhamna processing plant is still restricted. LNG send-outs also ramped up which further weighed on prompt contracts with the help of an upward revision in temperatures for next week.
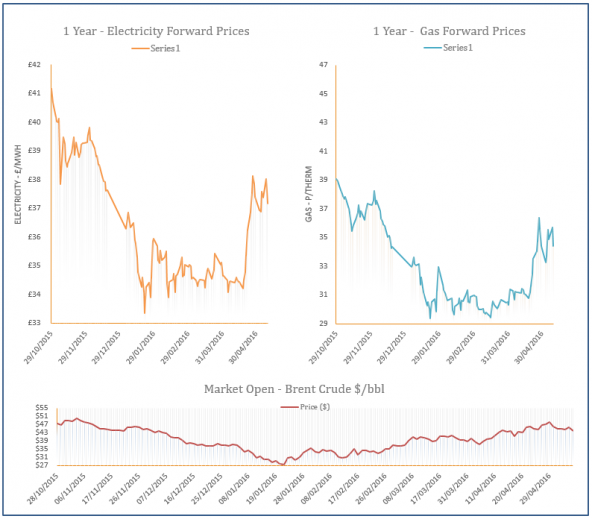
Energy Market Analysis - 10-05-2016
10th May 2016 | Posted by: Daniel Birkett | Market Analysis
Gas prices initially opened higher on Monday morning but a drop in oil prices helped contracts close at a discount. Unplanned outages at Norwegian facilities limited flows into the UK but warm weather reduced demand levels; helping the UK gas system remain close to balance. The morning's bullish movement was largely a result of a cooler weather forecast for the weekend and next week, with supply constraints also offering support.
Energy Market Analysis - 09-05-2016
9th May 2016 | Posted by: Daniel Birkett | Market Analysis
Prompt gas prices moved higher on Friday afternoon as Norwegian supply levels decreased, with weaker demand levels doing little to restrict the gains. Norwegian imports via the Langeled pipeline fell to 12mcm, while flows at the St Fergus terminal halted, resulting in a short gas system. Further along the curve the majority of contracts moved down as oil prices decreased.