


Apollo Energy publishes a daily energy market analysis, focusing on the gas, power and oil markets including a commentary on how the markets close and open. Our analysis provides insight on how the markets are performing and also considers various factors which could dictate price changes in the future.
The analysis also contains a graph which tracks the one-year forward price of both gas and electricity as well as changes to Brent crude oil.

Energy Market Analysis - 14-03-2016
14th March 2016 | Posted by: Daniel Birkett | Market Analysis
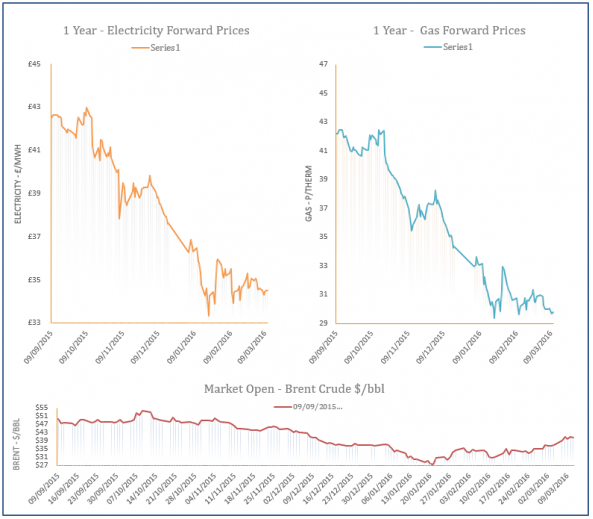
The gas curve displayed mixed movement on Friday as there was little change to fundamentals and the market volatility caused by Thursday’s ECB meeting settled down. The UK gas system opened long which helped contracts on the near-curve shed from their price, while strong Brent resulted in some gains further out.

Auto Rollover Contracts Are Costing Businesses Millions
14th March 2016 | Posted by: Daniel Birkett | Industry News
The Competition and Markets Authority (CMA) has revealed that small-to-medium sized businesses have overpaid on their gas and electricity bills by millions every year.
Energy Market Analysis - 11-03-2016
11th March 2016 | Posted by: Daniel Birkett | Market Analysis
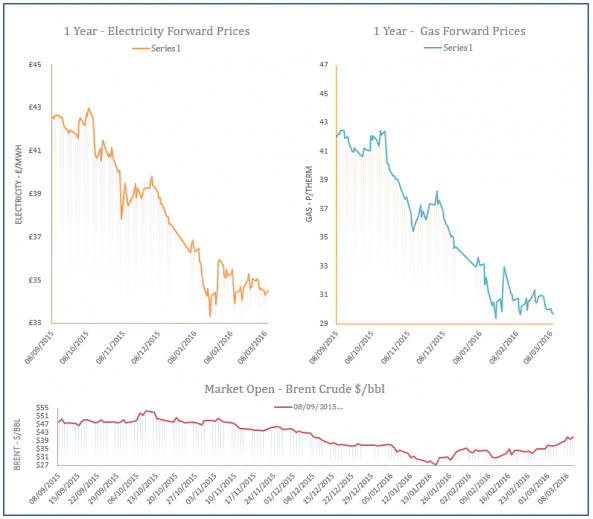
A lower demand forecast for the next few days helped to weigh on near-curve gas contracts yesterday. Contracts were unaffected by a drop in LNG send-outs which resulted in a short UK gas system, with higher Norwegian and Dutch flows improving the short term supply outlook. Movement further along the curve was generally mixed with direction coming from volatility on the oil and currency markets.
Energy Market Analysis - 10-03-2016
10th March 2016 | Posted by: Daniel Birkett | Market Analysis
Most gas contracts decreased yesterday afternoon as supply levels were comfortable and slightly milder temperatures led to a drop in demand. LNG send-outs increased from 38mcm to 66mcm with two deliveries expected to arrive in the UK this week, resulting in an oversupplied system. A rise in oil prices helped to support some contracts further along the curve but overall sentiment remained bearish.

Energy Market Analysis - 09-03-2016
9th March 2016 | Posted by: Daniel Birkett | Market Analysis
A mild weather forecast and a bearish oil market resulted in downward movement on the gas curve yesterday afternoon. Brent initially opened at its highest level since November but fell throughout the session, with the downward sentiment transferring to the gas market. Elsewhere, the supply picture was slightly weaker than previous sessions which helped to restrict some of the losses.