


Apollo Energy publishes a daily energy market analysis, focusing on the gas, power and oil markets including a commentary on how the markets close and open. Our analysis provides insight on how the markets are performing and also considers various factors which could dictate price changes in the future.
The analysis also contains a graph which tracks the one-year forward price of both gas and electricity as well as changes to Brent crude oil.
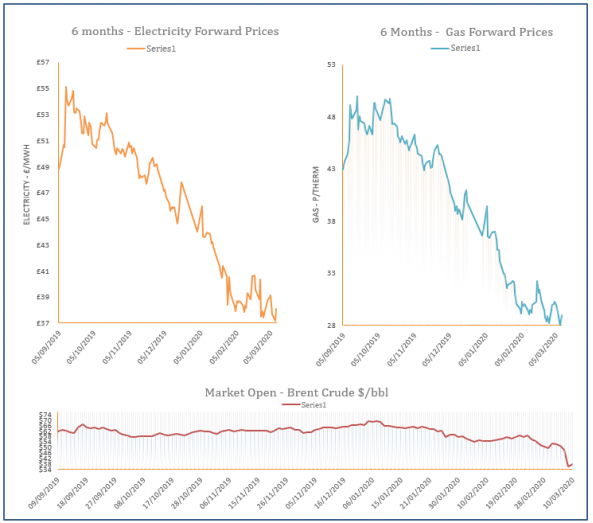
Energy Market Analysis – 10-03-2020
10th March 2020 | Posted by: Daniel Birkett | Market Analysis
Yesterday saw the largest single day drop in the price of oil since the Gulf War in 1991 when the price of Brent Crude fell by 35%. This has pressured down energy and equity markets across the Globe with UK gas markets following suit, helped by a better supply/ demand outlook.
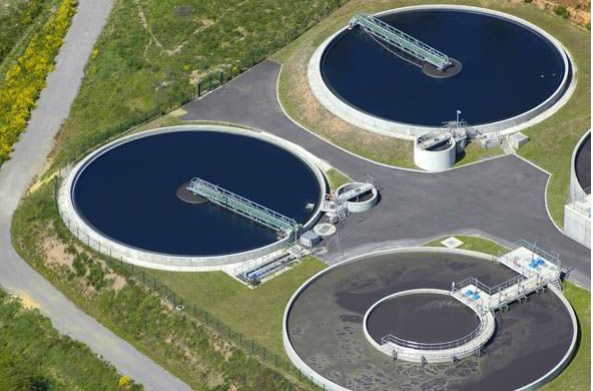
UK Water Industry Sets 2030 Net Zero Target
10th March 2020 | Posted by: Daniel Birkett | Industry News
The water industry aims to achieve net zero carbon emissions by 2030 based on ambitious plans released by the trade association, Water UK.

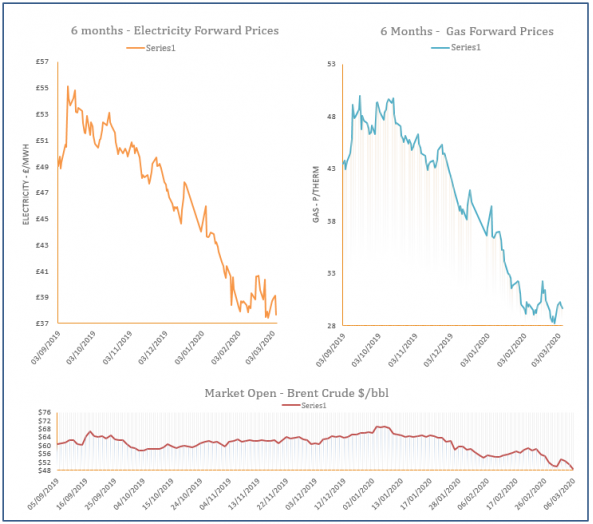
Energy Market Analysis – 09-03-2020
9th March 2020 | Posted by: Daniel Birkett | Market Analysis
Gas prices decreased on Friday as Russia rejected proposed OPEC production cuts, resulting in severe losses on oil markets. This had a knock on effect across all energy markets, while supply fundamentals were also slightly bearish.
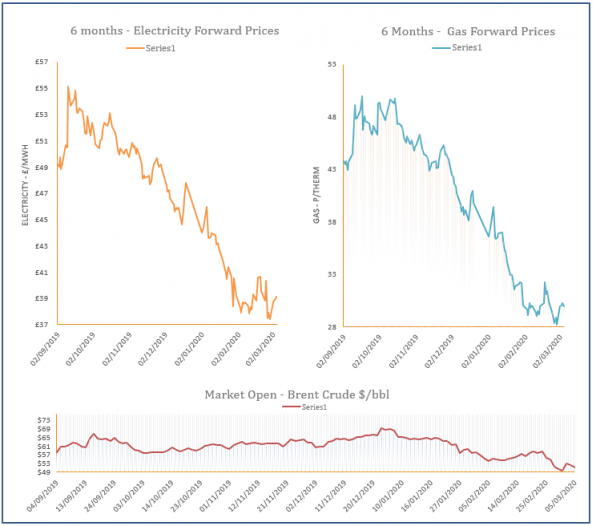
Energy Market Analysis – 06-03-2020
6th March 2020 | Posted by: Daniel Birkett | Market Analysis
Gas prices were pressured down by falling oil yesterday, although a tight system offered some resistance. Temperatures were also revised down for the start of next week, although should remain close to the seasonal norm.
Energy Market Analysis – 05-03-2020
5th March 2020 | Posted by: Daniel Birkett | Market Analysis
Gas prices inched lower on Wednesday despite a lack of clear direction. Oil prices moved down, while power showed mixed movement and coal & carbon increased. Meanwhile, an oversupplied system and milder weather outlook weighed on the near-curve.