


Energy Market Analysis - 04-10-2017
4th October 2017 | Posted by: Daniel Birkett | Market Analysis
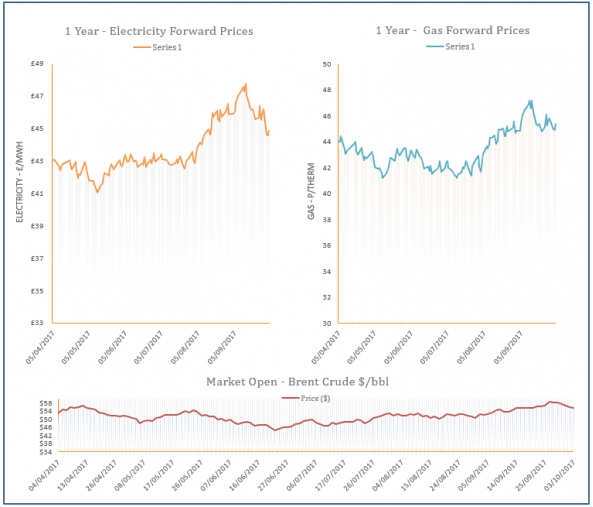
CCGT generation was down yesterday but colder weather is expected to lift residential demand for the rest of the week, resulting in gains on the near gas curve. On the supply front, the system opened slightly long due to a rise in LNG flows following deliveries at Dragon and the Isle of Grain. Meanwhile, prices on the far-curve were stable-to-bearish as a result of weaker Brent.
Energy Market Analysis - 03-10-2017
3rd October 2017 | Posted by: Daniel Birkett | Market Analysis
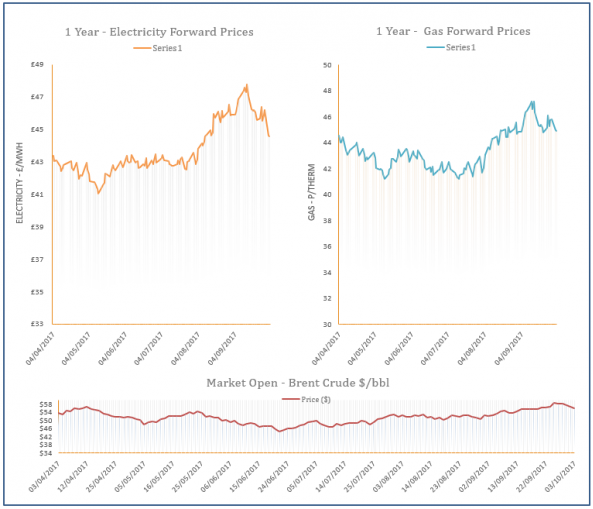
Gas prices moved higher during Monday’s session, recovering from the strong losses seen on Friday. Temperatures are set to turn colder later in the week which will lift demand levels, however, reduced gas-fired power generation limited gains on the near-curve. In terms of supply, Norwegian flows showed a significant increase as scheduled maintenance ended. Meanwhile, further support was provided to contracts on the far-curve by a rebound in coal prices.
Energy Market Analysis - 02-10-2017
2nd October 2017 | Posted by: Daniel Birkett | Market Analysis
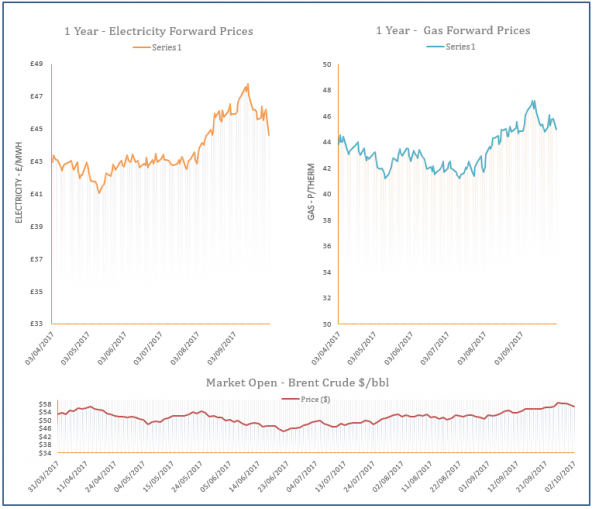
Gas prices decreased on Friday ahead of the new gas year and the expiration of numerous contracts. Weaker coal prices also applied bearish pressure to the far-curve, while temperatures during October are forecast to be milder than average, further weighing on contracts.