


Apollo Energy publishes a daily energy market analysis, focusing on the gas, power and oil markets including a commentary on how the markets close and open. Our analysis provides insight on how the markets are performing and also considers various factors which could dictate price changes in the future.
The analysis also contains a graph which tracks the one-year forward price of both gas and electricity as well as changes to Brent crude oil.
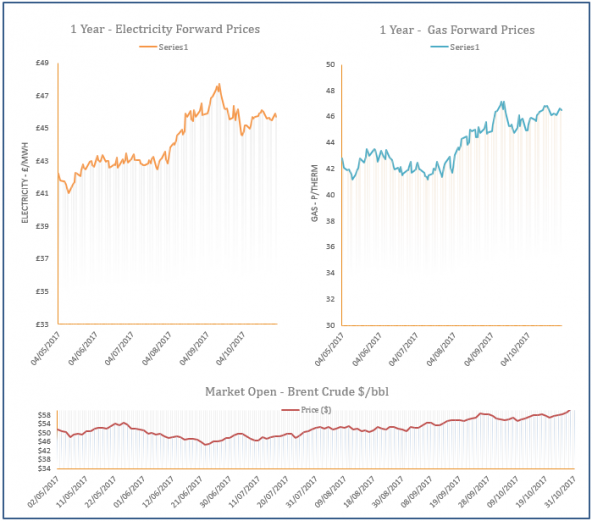
Energy Market Analysis - 31-10-2017
31st October 2017 | Posted by: Daniel Birkett | Market Analysis
A colder weather helped near-curve gas contracts to increase, with residential demand sitting 20% above the seasonal norm yesterday. However, milder temperatures are expected later in the week, capping some of the gains. Contracts further along the curve were generally stable as bullish momentum on coal and oil markets eased.
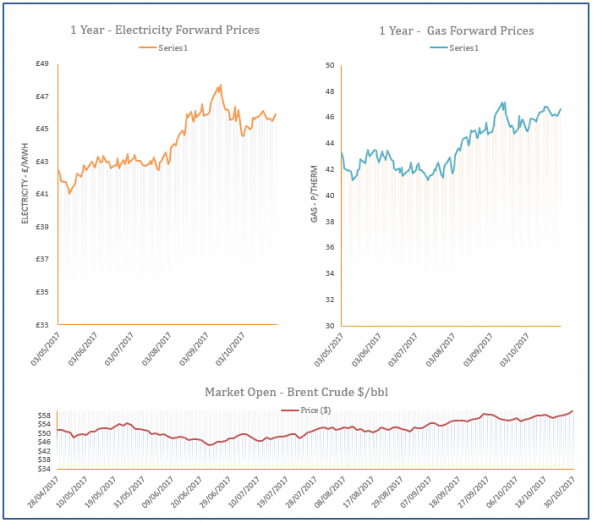
Energy Market Analysis - 30-10-2017
30th October 2017 | Posted by: Daniel Birkett | Market Analysis
Gas prices were pushed higher on Friday afternoon following a sharp rise in oil prices, assisted by rising coal and a colder weather outlook for this week. However, Norwegian flows improved and the Pound strengthened against the Euro, limiting some of the gains.

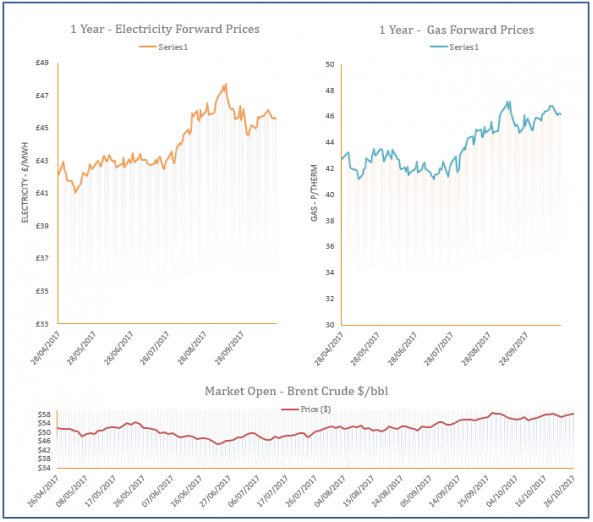
Energy Market Analysis - 27-10-2017
27th October 2017 | Posted by: Daniel Birkett | Market Analysis
Gas contracts displayed mixed movement on Thursday as the system fell short in the afternoon due to weakening Norwegian flows. Further out, a strong rise in oil prices was ignored and instead contracts were pressured down by weaker coal and power prices.
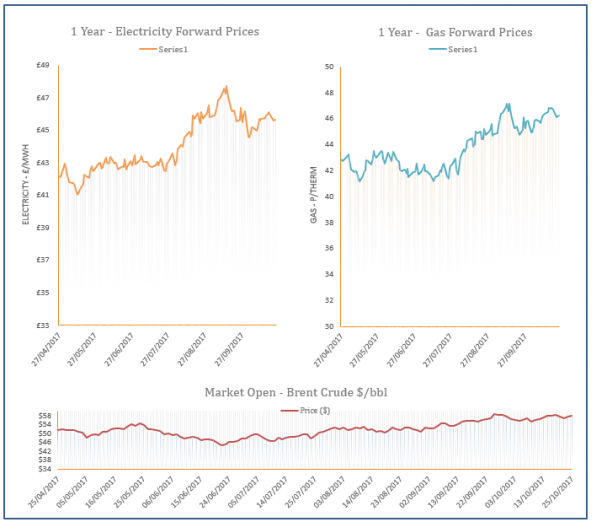
Energy Market Analysis - 26-10-2017
26th October 2017 | Posted by: Daniel Birkett | Market Analysis
Gas contracts increased across the curve yesterday with support provided by unplanned outages and a strengthening coal market. The Elgin-Franklin field did not return online until Wednesday evening and Norwegian flows were down due to issues at Kollsnes, limiting supply via the SEGAL pipeline into the UK.
Energy Market Analysis - 25-10-2017
25th October 2017 | Posted by: Daniel Birkett | Market Analysis
Near-curve gas prices were supported by unplanned outages at the Elgin-Franklin field and the Kollsnes processing plant yesterday which reduced supply levels by around 16mcm. Movement further along the curve was slightly bearish as movement on coal and oil markets was stable.