


Energy Market Analysis - 03-08-2017
3rd August 2017 | Posted by: Daniel Birkett | Market Analysis
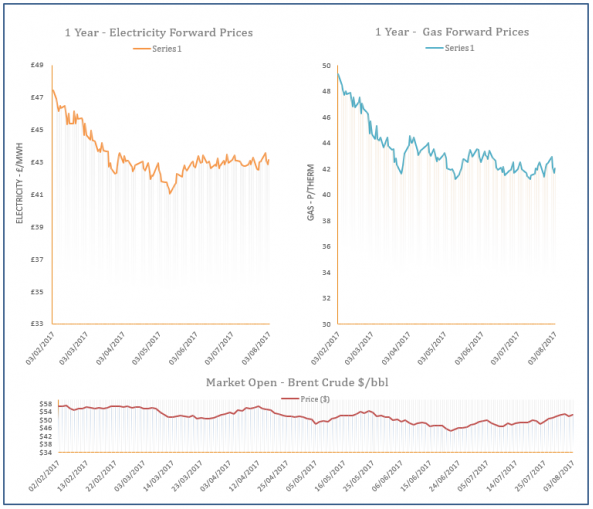
An expected rise in Russian flows to Europe helped to pressure down the market in the morning, but the on-going outage at Kollsnes erased losses on the near-curve as the session progressed; production capacity at the facility was down by 50mcm/ day. A rebound in oil prices also supported the far-curve but this was slightly offset by weakening coal.
Energy Market Analysis - 02-08-2017
2nd August 2017 | Posted by: Daniel Birkett | Market Analysis
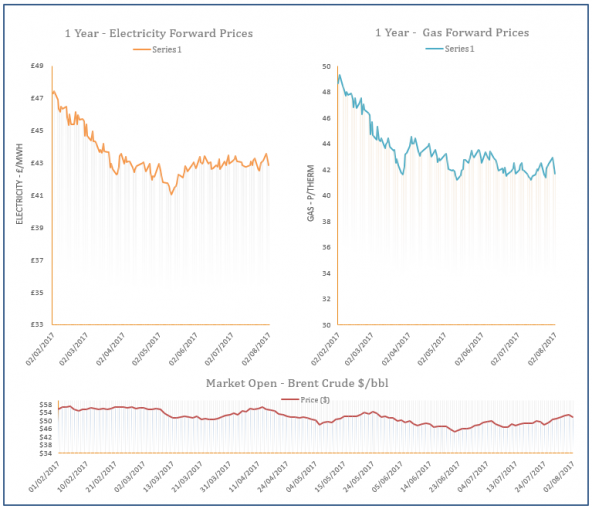
A rise in Norwegian output and a stronger outlook for Russian gas transit through the Nordstream pipeline weighed on European markets yesterday. Centrica also announced that 870mcm of gas will be produced at the Rough storage site between Q4-17 & Q1-18, further contributing to the losses. Meanwhile, coal and oil contracts shed from their price and helped towards bearish sentiment on the far-curve.
Energy Market Analysis - 01-08-2017
1st August 2017 | Posted by: Daniel Birkett | Market Analysis
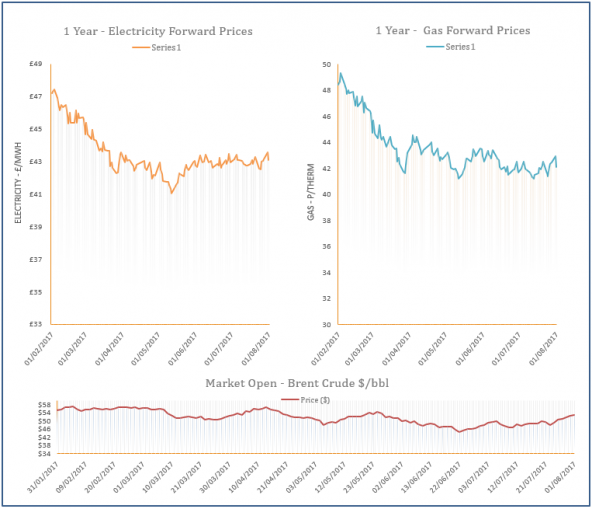
Day-Ahead gas climbed higher on Monday as a result of unplanned outages which impacted UKCS production and Norwegian imports. However, movement along the rest of the curve was minimal despite stronger coal prices, with resistance coming from an expected rise in Russian flows into Europe.