


Energy Market Analysis – 17-10-2018
17th October 2018 | Posted by: Daniel Birkett | Market Analysis
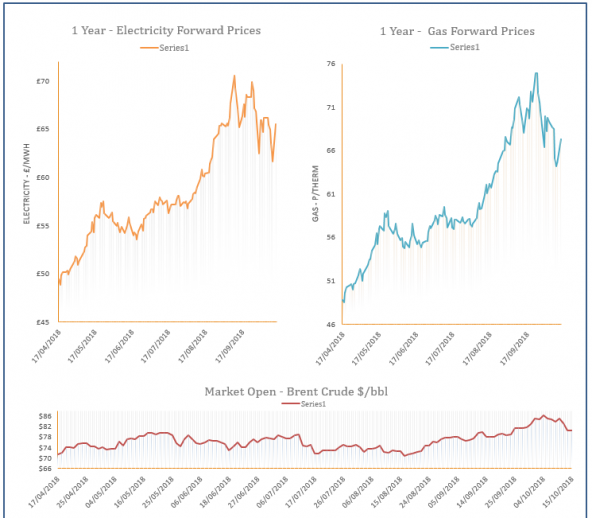
Near-curve gas prices turned bearish yesterday as UK supply was comfortable. LNG send-outs in Europe were at their highest levels since the end of February, while the system was oversupplied due to strong Norwegian flows, improved wind levels and milder weather. Further out, a rebound on coal, oil and carbon markets restricted any losses.

Energy Market Analysis – 16-10-2018
16th October 2018 | Posted by: Daniel Birkett | Market Analysis
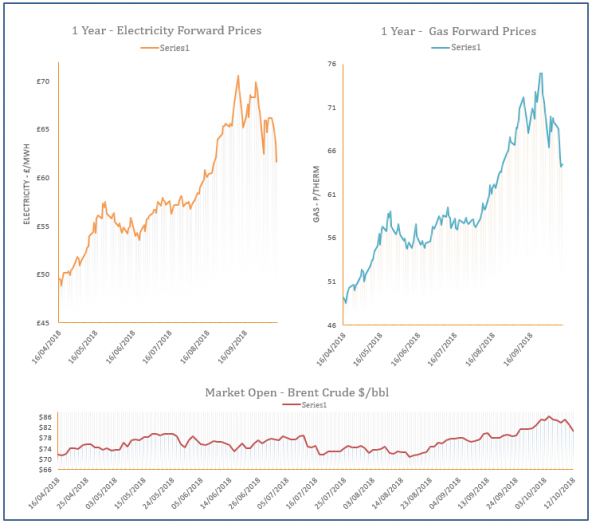
Movement along the gas curve was mixed yesterday with colder weather and weak wind generation lifting demand levels which resulted in gains at the front of the curve. Meanwhile, some losses were recorded at the back of the curve following a sharp decrease in EUA prices, ahead of fears that the UK could leave the EU ETS.
Energy Market Analysis – 15-10-2018
15th October 2018 | Posted by: Daniel Birkett | Market Analysis
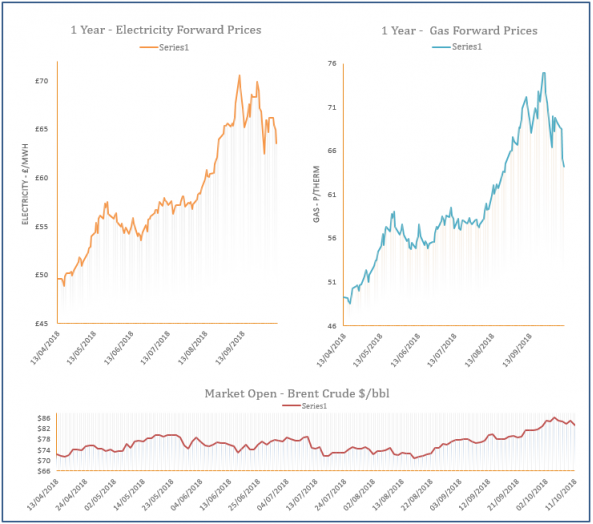
Gas prices moved higher on Friday as temperatures for this week were revised down and an increase in storage injections is expected, tightening the system. Residential demand was forecast to rise by over 30mcm today but improved LNG flows should help to make up the difference. Further out, prices continued to take direction from rising commodity markets.
Energy Market Analysis - 12-10-2018
12th October 2018 | Posted by: Daniel Birkett | Market Analysis
Gas prices decreased on Thursday as a result of weaker demand levels and improved LNG send-outs. Demand was pushed down by a rise in wind power, while LNG send-outs at the Dutch Gate terminal reached a 6-month high. Meanwhile, falling commodity markets continued to weigh on the back of the curve.
Energy Market Analysis – 11-10-2018
11th October 2018 | Posted by: Daniel Birkett | Market Analysis
A drop in demand thanks to healthy renewable power levels and warm weather resulted in losses on the near-curve yesterday. LNG send-outs also increased, rising to 144mm cm, compared to the September average of 85 mm cm, with a number of deliveries expected to dock in Europe this month.