


Energy Market Analysis – 31-08-2018
31st August 2018 | Posted by: Lawrence Carson | Market Analysis
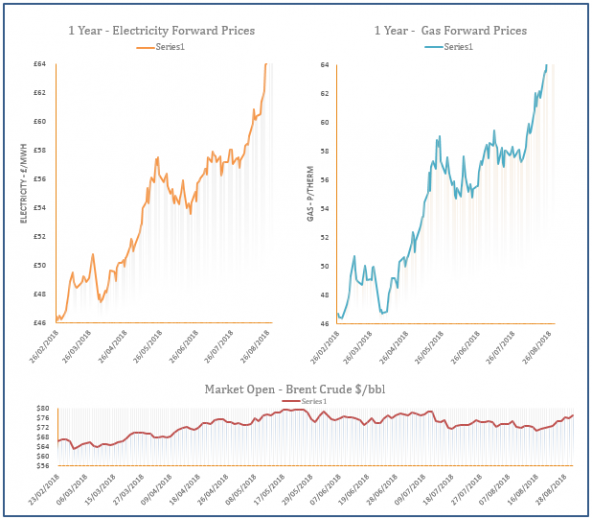
Gas prices were mixed yesterday, showing higher values on the curve but lower on the spot. On the far curve, the rise in oil and EUA prices was slightly offset by the sharp fall in coal prices.
Energy Market Analysis – 30-08-2018
30th August 2018 | Posted by: Lawrence Carson | Market Analysis
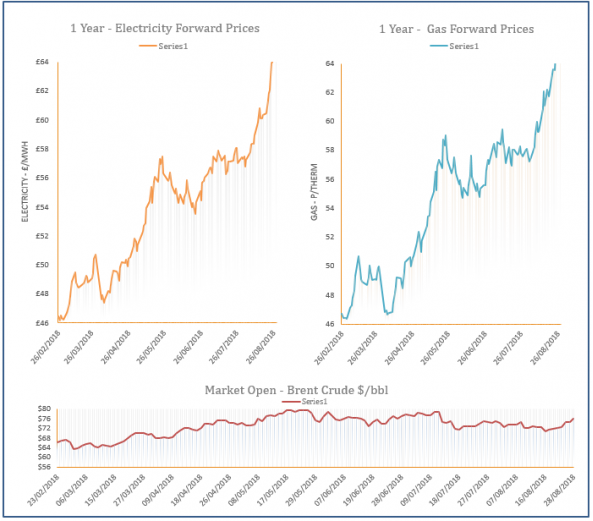
Power margins were corrected downwards yesterday, Q4-18 contracts rose again rather sharply, as power markets are driven by tight short term fundamentals.

Energy Market Analysis – 29-08-2018
29th August 2018 | Posted by: Lawrence Carson | Market Analysis
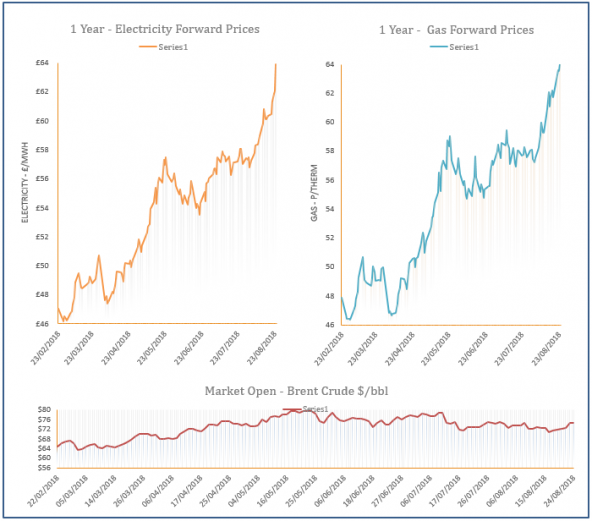
Gas Power Market Close Market Close After the UK market was closed on Monday, prices rose, catching up with continental markets. Although the decision to suspend strike action planned for the 3rd September helped lower fears of supply. A lack of wind and nuclear power, slightly higher demand and rising fossil fuel prices all contributed to prices remaining at a high level. Further out, powe…
Energy Market Analysis – 28-08-2018
28th August 2018 | Posted by: Lawrence Carson | Market Analysis
Gas Power Market Close Market Close Trading activity on the European gas markets was weak yesterday due to the UK market being closed. The bullish price trend continued as confirmed by trades on the continent. Increases on gas, carbon and coal markets boosted power prices again. Decreases in nuclear power availability, along with a lack of wind power also meant higher power margins. Marke…
Energy Market Analysis – 24-08-2018
24th August 2018 | Posted by: Lawrence Carson | Market Analysis
Gas prices have increased across the curve due significant moves on the carbon market. In addition flows from Norway have also decreased due to planned maintenance which has provided additional support to the front of the curve.