


Energy Market Analysis - 09-08-2018
9th August 2018 | Posted by: Daniel Birkett | Market Analysis
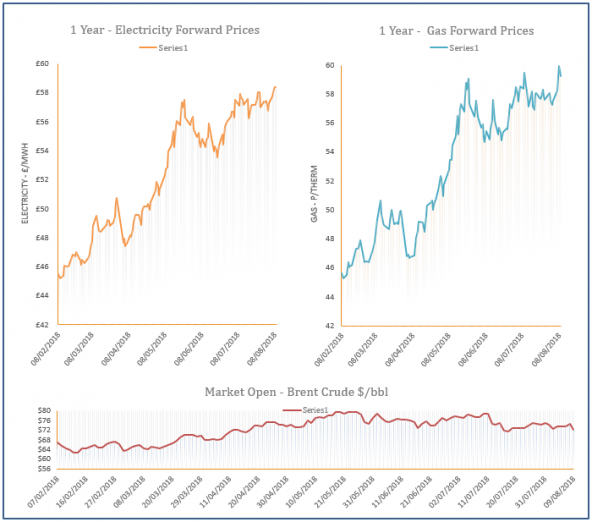
The latest EIA report resulted in weaker oil prices yesterday afternoon which transferred to the gas curve, with a significant drop in coal prices also a contributing factor. The prompt erased its morning gains and ended the session almost unchanged, with an expected rise in supply via Bacton SEAL helping to weigh on the near-curve.
Energy Market Analysis - 08-08-2018
8th August 2018 | Posted by: Daniel Birkett | Market Analysis
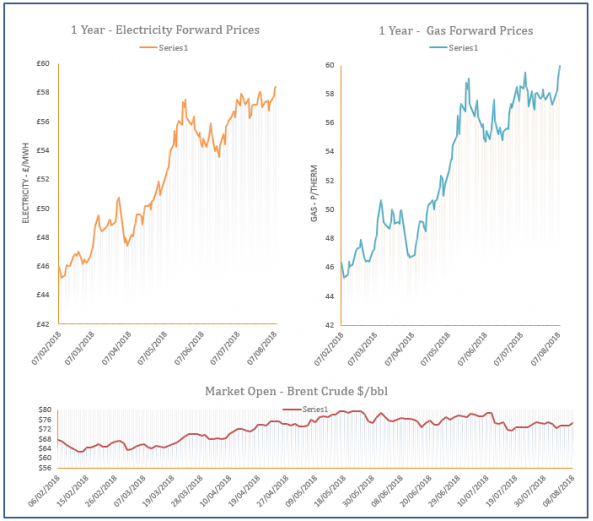
Gas prices increased yesterday, reaching levels that were 5p higher than the average price last winter, with bullish pressure provided by rising coal and oil markets. However, upward movement at the front of the curve was offset by a cooler weather forecast and an expected rise in supply from the Bacton SEAL terminal.
Energy Market Analysis - 07-08-2018
7th August 2018 | Posted by: Daniel Birkett | Market Analysis
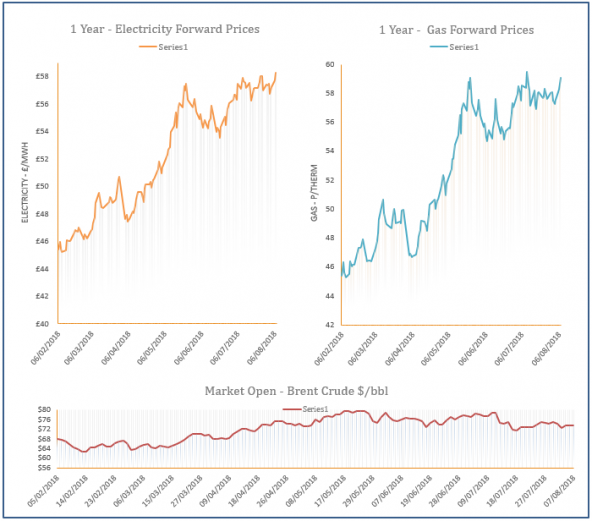
Gas contracts added to their price on Monday following a sharp rise in coal prices, in addition to a bullish oil market. Sanctions on Iran and a drop in Saudi oil production helped to lift oil prices, while coal was supported by Chinese demand. The short term supply/ demand outlook was little changed from last week and gas prices instead found direction from fuel markets.

Energy Market Analysis - 06-08-2018
6th August 2018 | Posted by: Daniel Birkett | Market Analysis
Gas prices climbed higher on Friday with direction coming from bullish fuel markets, with carbon, coal and oil prices all posting gains. A healthier renewable power outlook for the start of this week will reduce CCGT demand, capping gains at the front of the curve but the overall trend remained bullish.

Energy Market Analysis - 03-08-2018
3rd August 2018 | Posted by: Daniel Birkett | Market Analysis
Gas prices displayed little movement yesterday as oil and coal markets moved in the opposite directions, cancelling each other out. Cooler temperatures also led to a slight rise in residential demand, with weaker renewables forecast for today, lifting CCGT demand; this helped to cap any bearish movement on the near-curve.