


Energy Market Analysis – 24-01-2019
24th January 2019 | Posted by: Daniel Birkett | Market Analysis
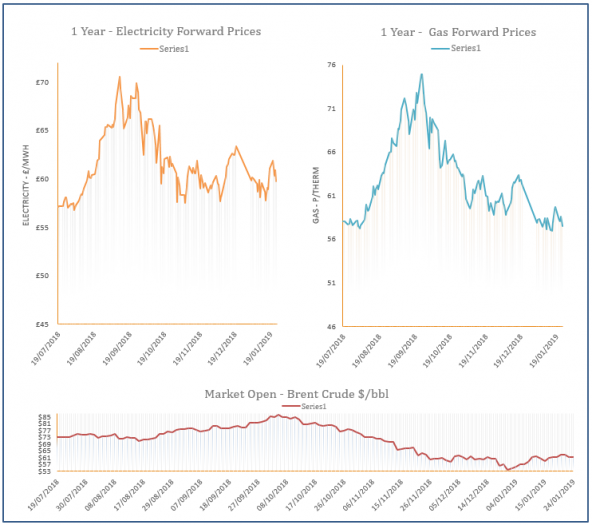
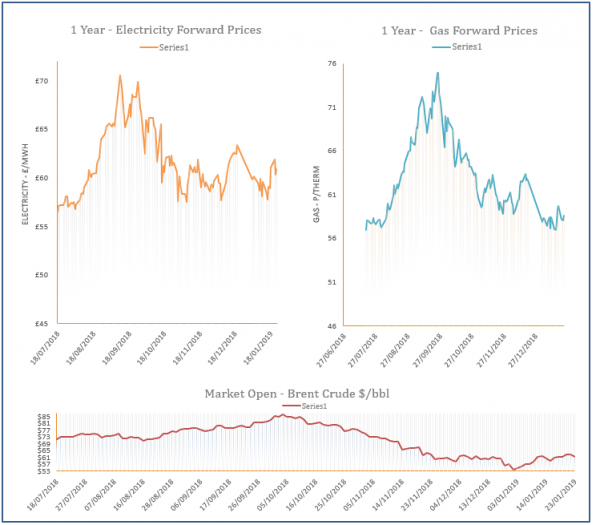
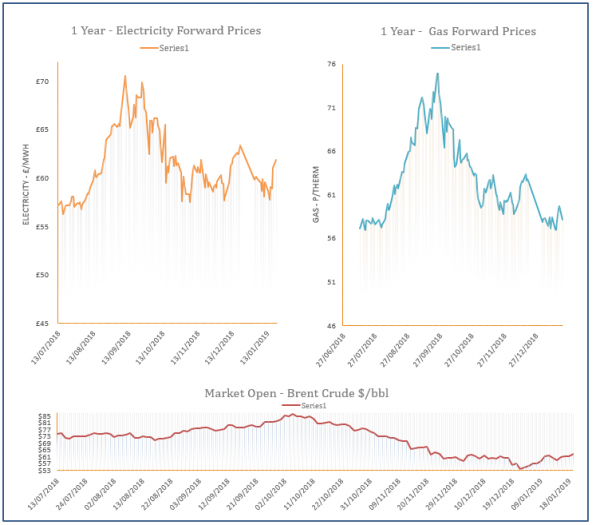
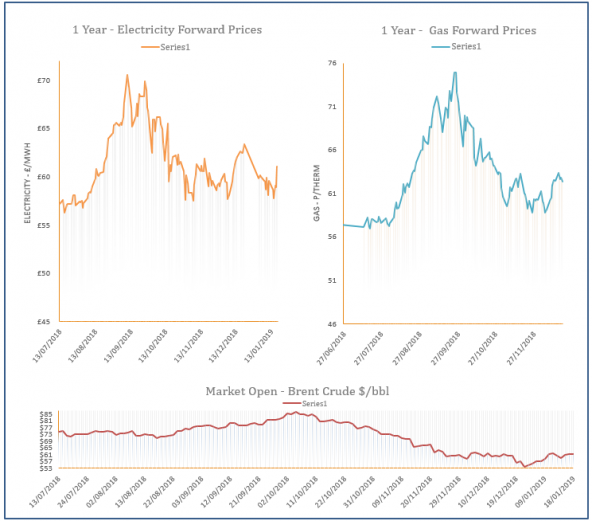
Near-curve gas prices ticked higher on Wednesday as the system fell short due colder weather which increased residential demand, while weak renewables also lifted CCGT demand. Further out, any gains were capped by a drop in oil and carbon.
Energy Market Analysis – 23-01-2019
23rd January 2019 | Posted by: Daniel Birkett | Market Analysis
UK gas prices displayed minor losses yesterday afternoon with help from a stronger Pound and an oversupplied system. Stronger power contracts limited any downward movement on the near-curve, while bullish coal and carbon offered resistance further out.

Energy Market Analysis – 22-01-2019
22nd January 2019 | Posted by: Daniel Birkett | Market Analysis
Gas prices recorded strong losses yesterday as milder weather was forecast towards the end of the month, while LNG send-outs are healthy. Coal, power and carbon markets also eased down, further weighing on prices.
Energy Market Analysis – 21-01-2019
21st January 2019 | Posted by: Lawrence Carson | Market Analysis
Gas Power Market Close Market Close Friday afternoon saw near curve contract prices soften as revised weather forecasts shown warmer weather than expected for late January. Further out, far curve contracts held strong as the wider commodity markets strengthened. A mixed outcome on Friday for power as near curve prices followed the bearish NBP markets whilst contracts further out tracked the…
Energy Market Analysis – 18-01-2019
18th January 2019 | Posted by: Daniel Birkett | Market Analysis
Gas prices climbed higher yesterday with the expectation of colder weather supporting prices along the near-curve, ignoring a long system. Meanwhile, prices further along the curve followed rising commodity markets.