


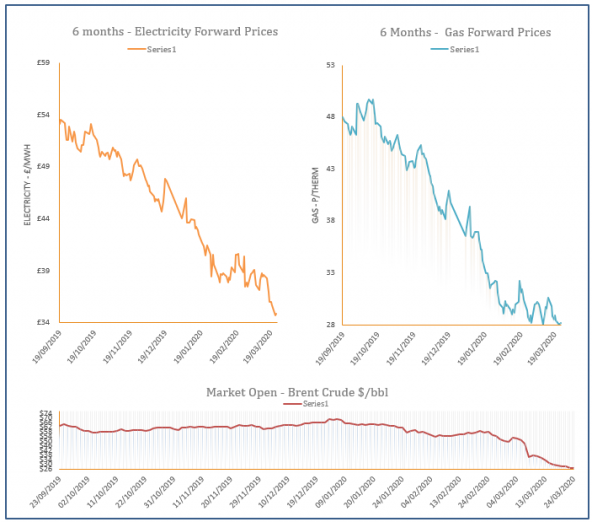
Energy Market Analysis – 24-03-2020
24th March 2020 | Posted by: Daniel Birkett | Market Analysis
The gas curve saw a brief return to normality yesterday with no extreme fluctuations, as movement was largely driven by supply fundamentals, rather than the current economical climate. Meanwhile, a drop in coal, carbon and power helped towards some losses in an overall bearish session.
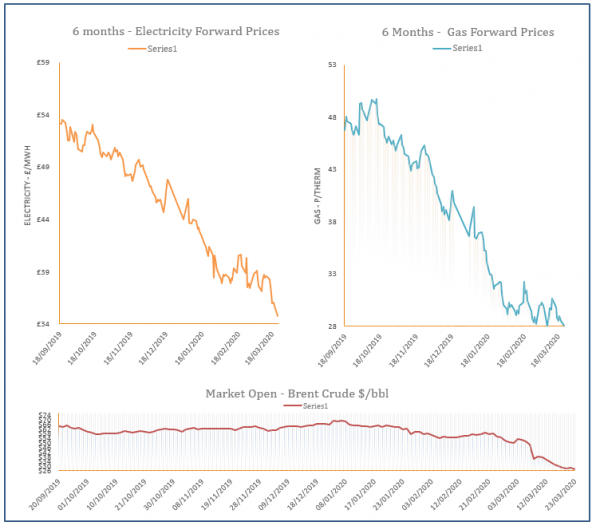
Energy Market Analysis – 23-03-2020
23rd March 2020 | Posted by: Daniel Birkett | Market Analysis
Gas prices decreased during Friday’s session, rounding off an overall bearish week on energy markets. Precautions taken to stop the spread of the Coronavirus impacted economies across the world, although the Pound strengthened slightly, lowering import costs from Europe.
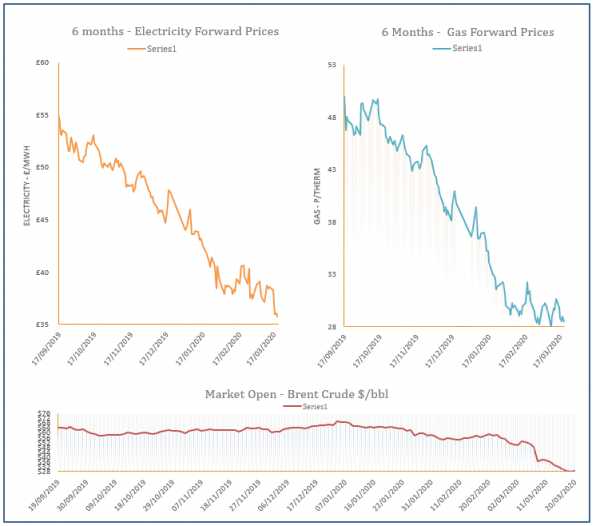
Energy Market Analysis – 20-03-2020
20th March 2020 | Posted by: Daniel Birkett | Market Analysis
Gas prices inched higher yesterday, following rebounds across the broader energy complex, with oil dictating most movement. Longer dated contracts were the most resilient with the more significant recoveries seen at the front of the curve,
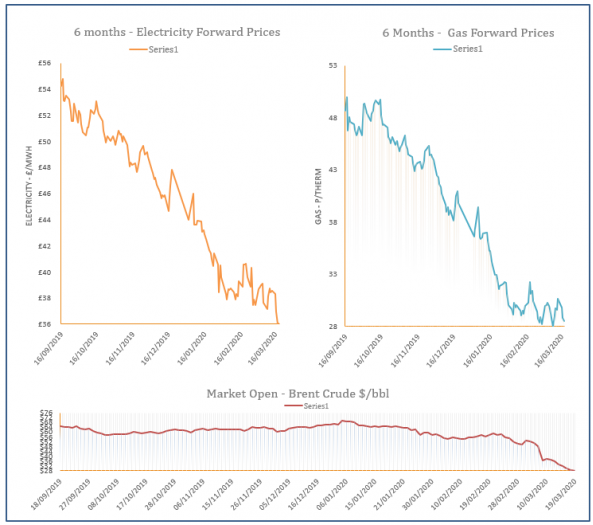
Energy Market Analysis – 19-03-2020
19th March 2020 | Posted by: Daniel Birkett | Market Analysis
Gas contracts displayed only minor losses by the end of Wednesday’s session, with the larger decreases recorded towards the back of the curve. Carbon continued to fall, as did coal, while the oil market remained extremely weak.
Energy Market Analysis – 18-03-2020
18th March 2020 | Posted by: Daniel Birkett | Market Analysis
Gas contracts shed from their price on Tuesday, continuing to follow the broader energy complex and falling equity markets, resulting in talk of a possible recession. Losses were not as significant as previous sessions but an expected rise in demand today offered additional support to the prompt.