


Energy Market Analysis – 10-03-2020
10th March 2020 | Posted by: Daniel Birkett | Market Analysis
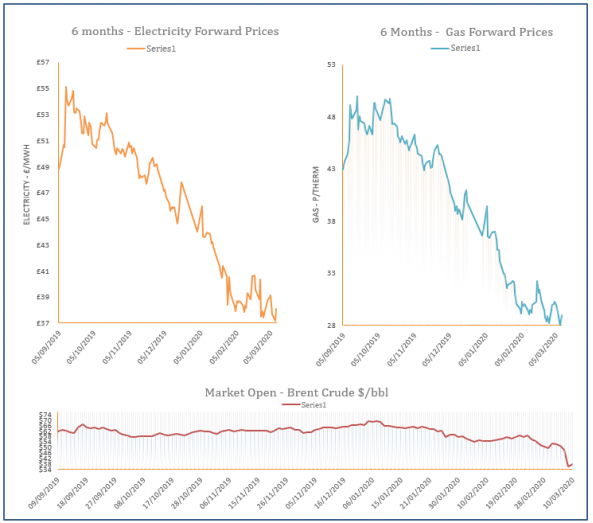
Yesterday saw the largest single day drop in the price of oil since the Gulf War in 1991 when the price of Brent Crude fell by 35%. This has pressured down energy and equity markets across the Globe with UK gas markets following suit, helped by a better supply/ demand outlook.

Energy Market Analysis – 09-03-2020
9th March 2020 | Posted by: Daniel Birkett | Market Analysis
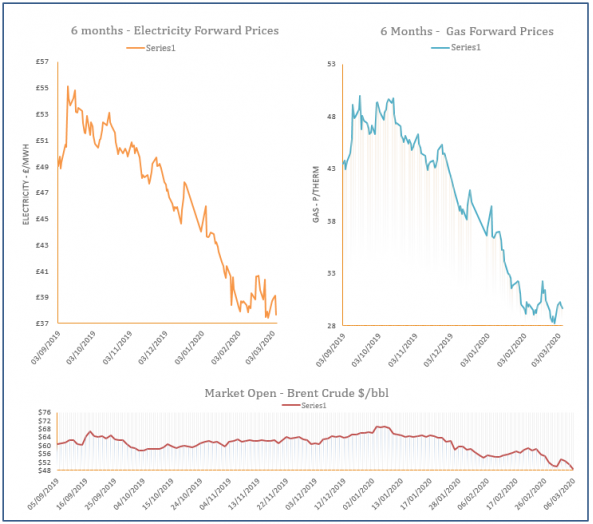
Gas prices decreased on Friday as Russia rejected proposed OPEC production cuts, resulting in severe losses on oil markets. This had a knock on effect across all energy markets, while supply fundamentals were also slightly bearish.
Energy Market Analysis – 06-03-2020
6th March 2020 | Posted by: Daniel Birkett | Market Analysis
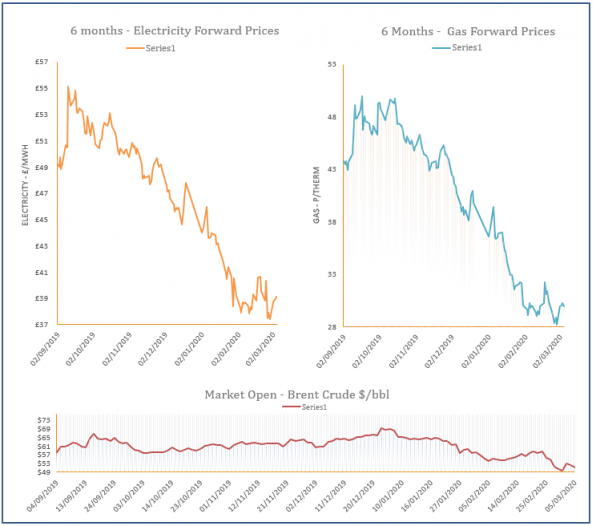
Gas prices were pressured down by falling oil yesterday, although a tight system offered some resistance. Temperatures were also revised down for the start of next week, although should remain close to the seasonal norm.
Energy Market Analysis – 05-03-2020
5th March 2020 | Posted by: Daniel Birkett | Market Analysis
Gas prices inched lower on Wednesday despite a lack of clear direction. Oil prices moved down, while power showed mixed movement and coal & carbon increased. Meanwhile, an oversupplied system and milder weather outlook weighed on the near-curve.
Energy Market Analysis – 04-03-2020
4th March 2020 | Posted by: Daniel Birkett | Market Analysis
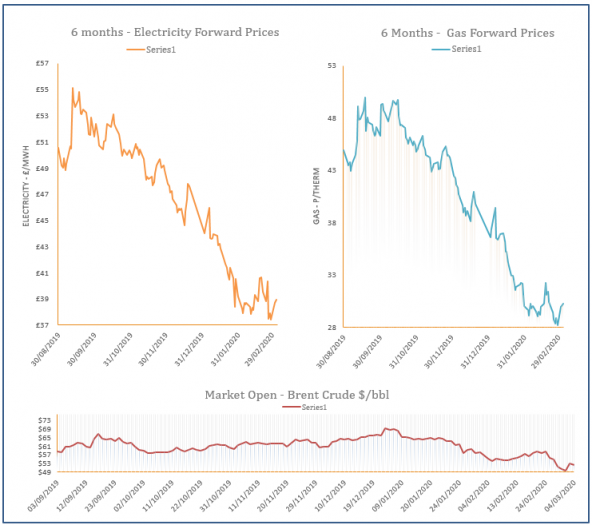
Gas prices climbed higher on Tuesday, with the larger gains displayed by longer dated contracts. Energy markets were dictated by a rebound in oil, although the front of the curve was more subdued because of a balanced system.