


Energy Market Analysis – 14-05-2020
14th May 2020 | Posted by: Daniel Birkett | Market Analysis
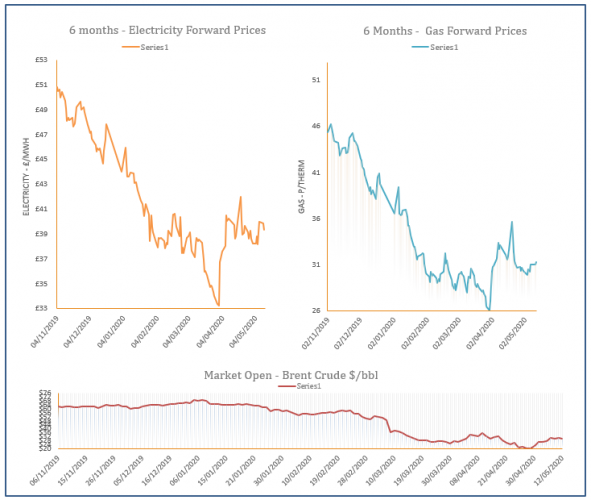
Gas prices were bearish in the main during Wednesday’s session, pressured down by weakening coal and oil following a sell-off on stock markets. Recent cases of Coronavirus in Germany & South Korea pushed traders into cashing in on profits, fearing a new wave of the pandemic.

Energy Market Analysis – 13-05-2020
13th May 2020 | Posted by: Daniel Birkett | Market Analysis
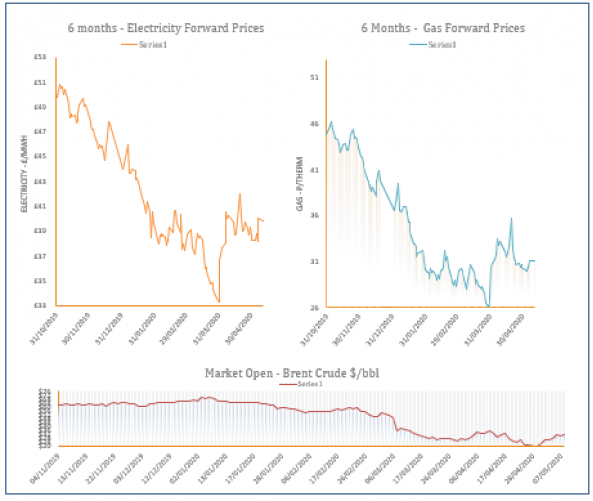
Gas prices dipped lower across the curve yesterday as weak demand and surplus supply balanced the system, while coal and carbon both moved down. Oil was the only market to trade higher but the gains were minor.
Energy Market Analysis – 12-05-2020
12th May 2020 | Posted by: Daniel Birkett | Market Analysis
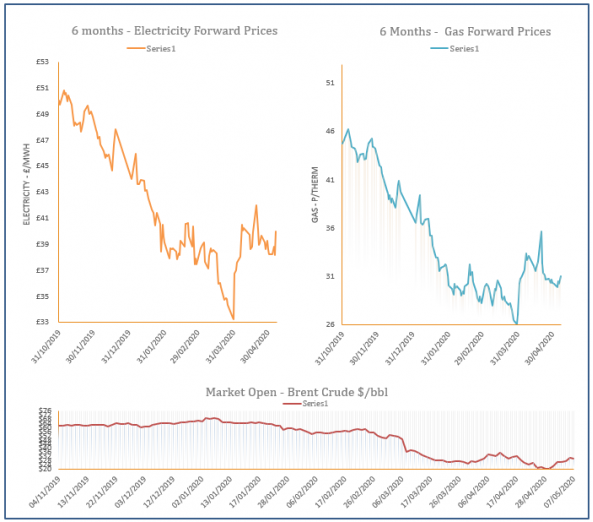
Near curve gas prices decreased on Monday, taking direction from a balanced system. Overall demand levels remained low despite a drop in temperatures, while healthy renewables reduced gas-fired power demand.
Energy Market Analysis – 11-05-2020
11th May 2020 | Posted by: Lawrence Carson | Market Analysis
Bank holiday in most countries meant European gas prices traded mostly sideways on Friday. Most contracts traded at all time lows, however steady Brent prices above the $30/b mark played into the bullish sentiment on the far curve.
Energy Market Analysis – 07-05-2020
7th May 2020 | Posted by: Daniel Birkett | Market Analysis
Gas prices inched higher on Wednesday, with the front of the curve supported by an undersupplied system due to increased gas-fired power demand. Meanwhile, the overall energy complex was generally stable compared to previous sessions.