


Energy Market Analysis – 29-05-2020
29th May 2020 | Posted by: Daniel Birkett | Market Analysis
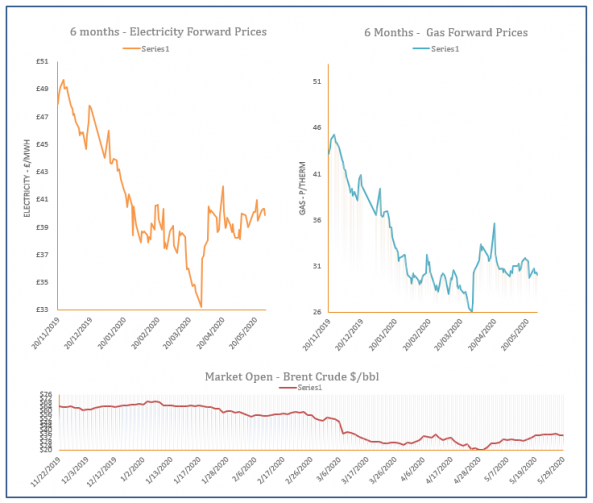
Gas markets decreased during Thursday’s session due to bearish fundamentals. Stocks are nearing capacity earlier than normal this year, while warm weather is reducing demand. LNG deliveries to Europe are also less frequent due to the excess in supply.
Energy Market Analysis – 28-05-2020
28th May 2020 | Posted by: Daniel Birkett | Market Analysis
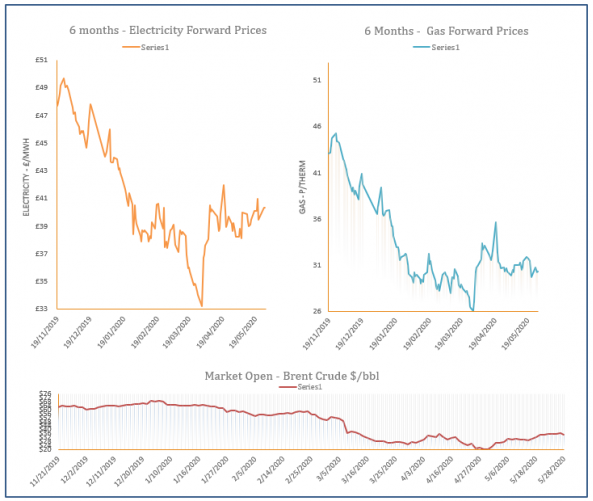
A drop in oil pressured down energy markets yesterday, including gas. Recovering global equities did little to support commodities, with coal and carbon also moving lower. A rise in gas-fired power demand sent the system short but its impact was limited by a warm weather outlook.

Energy Market Analysis – 27-05-2020
27th May 2020 | Posted by: Daniel Birkett | Market Analysis
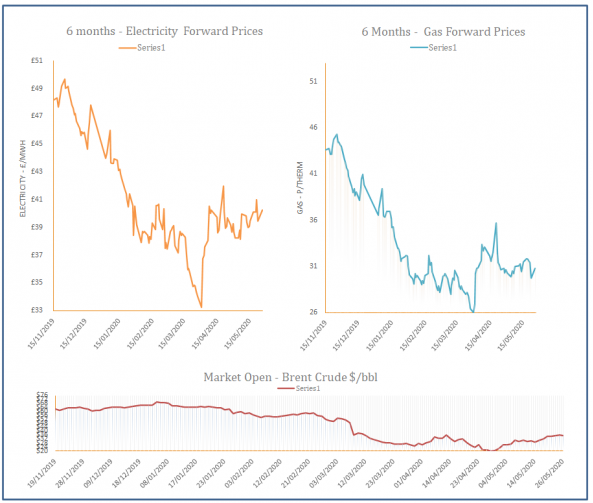
Gas prices rebounded yesterday, catching up with global markets following the bank holiday on Monday. Stock markets and commodities all strengthened over the weekend as the easing of lockdowns has boosted economies.
Energy Market Analysis - 26-05-2020
26th May 2020 | Posted by: Rebecca Haughton | Market Analysis
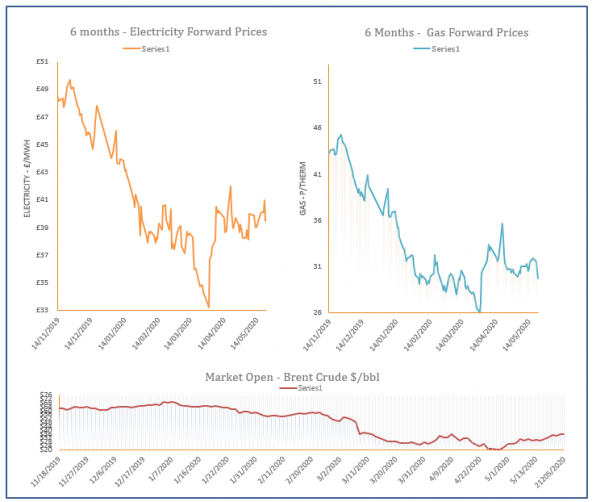
Gas trading took a break yesterday for the UK bank holiday, the energy complex rose with statements form the IEA and Russia that suggest the global oil market will balance later this summer.
Energy Market Analysis – 22-05-2020
22nd May 2020 | Posted by: Daniel Birkett | Market Analysis
Gas prices displayed strong losses yesterday, with the largest decreases displayed at the front of the curve. A weak demand forecast for the bank holiday and an expected drop in gas-fired power demand contributed to the bearish sentiment.