


Energy Market Analysis – 30-06-2020
30th June 2020 | Posted by: Daniel Birkett | Market Analysis
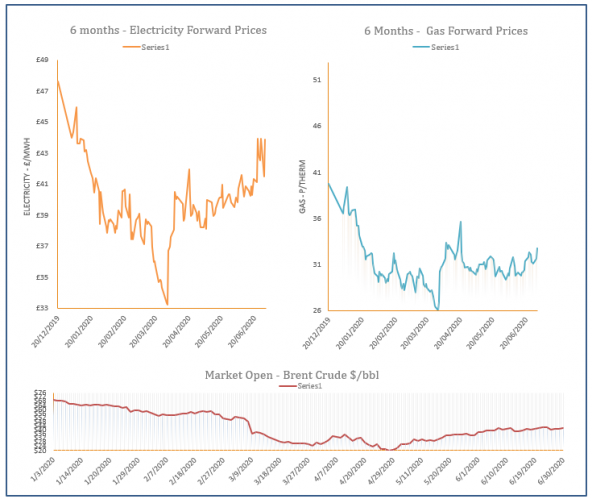
Gas prices turned bullish yesterday afternoon, following a rebound on overall European energy markets and a rise in global commodities. LNG prices also increased as a major shale gas producer in the US filed for bankruptcy.
Energy Market Analysis – 29-06-2020
29th June 2020 | Posted by: Daniel Birkett | Market Analysis
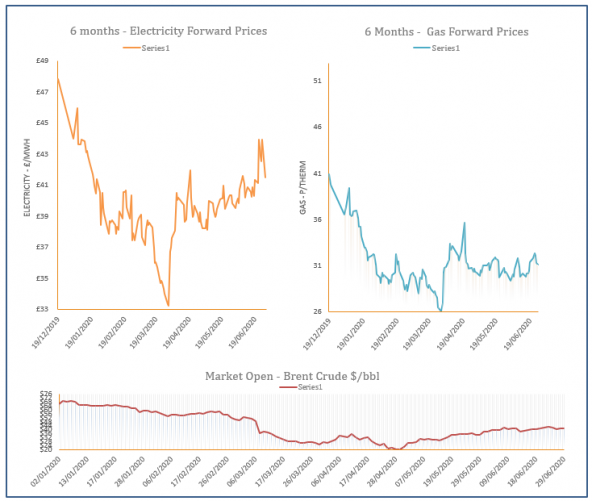
Gas traded slightly higher by Friday’s close, all be it marginally. Coal and power both offered support, in addition to a weaker Pound, while stable oil and weaker carbon provided some resistance.
Energy Market Analysis – 26-06-2020
26th June 2020 | Posted by: Daniel Birkett | Market Analysis
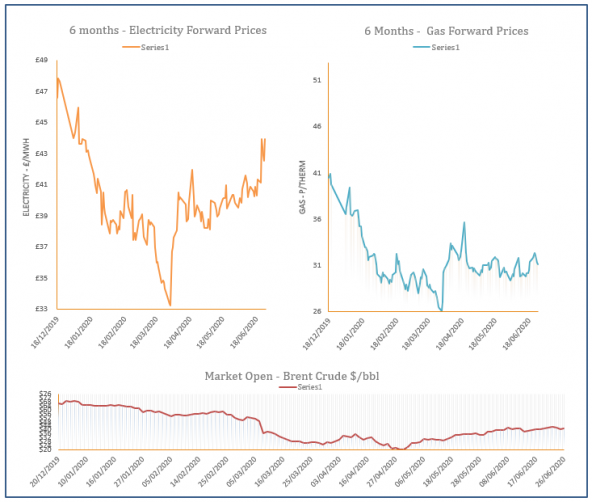
Gas prices moved down yesterday, tracking movement on overall energy markets following a sell off on trading floors. Oil, coal and carbon all displayed losses in a very bearish session.
Energy Market Analysis – 25-06-2020
25th June 2020 | Posted by: Daniel Birkett | Market Analysis
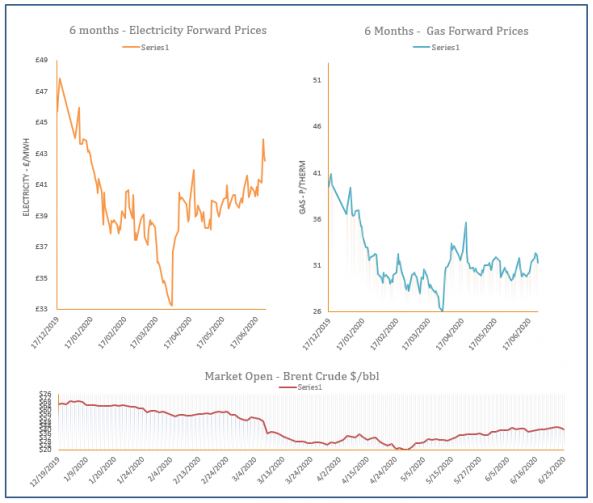
Gas prices traded higher yesterday morning which had a knock-on effect for power and carbon contracts. However, global markets moved down in the afternoon due to a strong rise in US crude stocks and concerns regarding new cases of the Coronavirus. As a result, gas prices ended the session almost unchanged.
Energy Market Analysis – 24-06-2020
24th June 2020 | Posted by: Daniel Birkett | Market Analysis
Gas prices increased across the curve during Tuesday’s session, with the front of the curve pushed higher by a stronger demand outlook. Further out, contracts found support from a rise in coal, carbon, power and equities, with only the oil market trading lower.