


Energy Market Analysis - 15-05-2017
15th May 2017 | Posted by: Daniel Birkett | Market Analysis
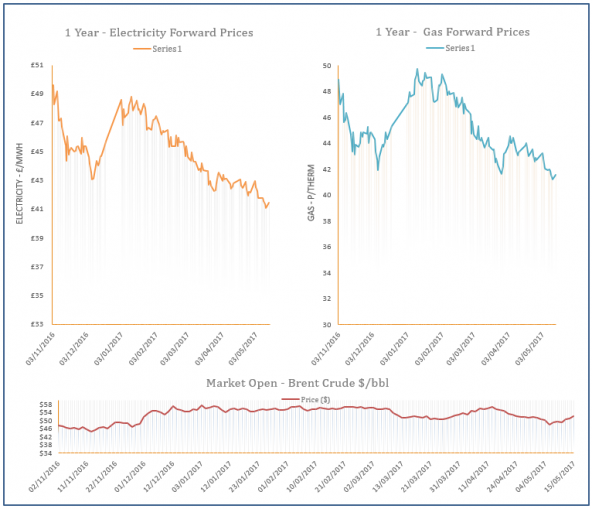
Gas contracts increased on Friday following a rise in buying interest as traders looked to exploit strong losses earlier in the week. Norwegian flows were also restricted due to on-going maintenance at a number of fields. Meanwhile, coal and oil contracts strengthened, offering additional support to the far-curve, with a weaker Pound also a factor.

Energy Market Analysis - 12-05-2017
12th May 2017 | Market Analysis
European gas spot and near curve prices weakened yesterday, pressured by weak demand forecasts due to expectations of warmer weather.

Energy Market Analysis - 11-05-2017
11th May 2017 | Market Analysis
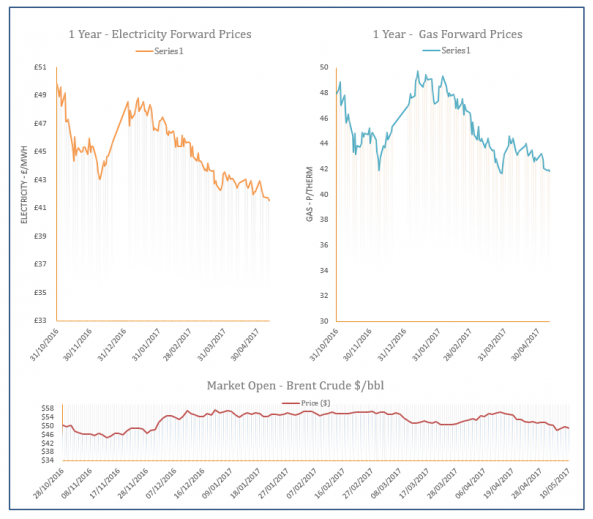
European gas prices were rangebound on Wednesday, pressured by weak demand forecasts in the coming days on one side and supported by a rebound in oil prices on the other. Norwegian gas exports to Europe fell to their lowest level since September 2016, which is mainly due to planned field maintenance work over the next three days.
Energy Market Analysis - 10-05-2017
10th May 2017 | Posted by: Natalie Ormrod | Market Analysis
Despite higher-than-expected demand due to cool weather, European gas spot and near curve prices weakened yesterday, pressured by forecasts of higher temperatures in the coming days.
Energy Market Analysis - 09-05-2017
9th May 2017 | Posted by: Natalie Ormrod | Market Analysis
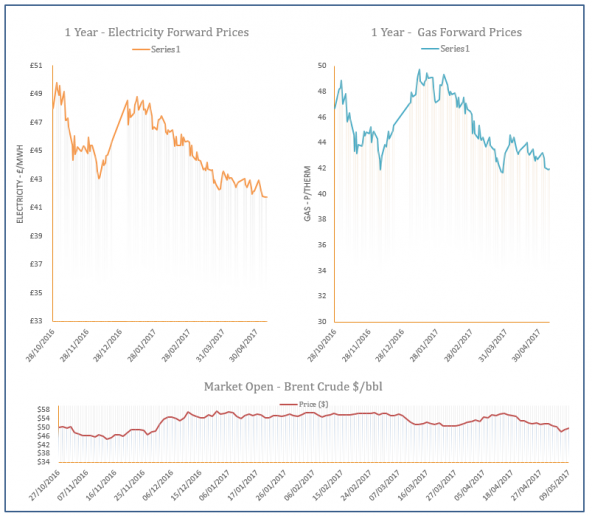
European Gas prices weakened further yesterday, pressured by falling coal prices and a sharp upward revision in temperature forecasts. The UK system opened short due to lower Norwegian supply, but was balanced by a fall in exports and rising storage and LNG withdrawals.