


Energy Market Analysis - 08-05-2017
8th May 2017 | Posted by: Natalie Ormrod | Market Analysis
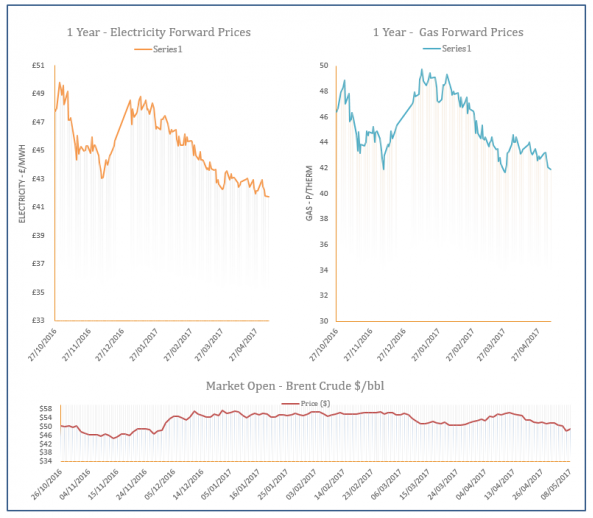
UK gas prices fell for a second day on Friday. The expected drop in Norwegian supply weighed on prices throughout the day, until a late rally on Friday afternoon.
Energy Market Analysis - 05-05-2017
5th May 2017 | Posted by: Natalie Ormrod | Market Analysis
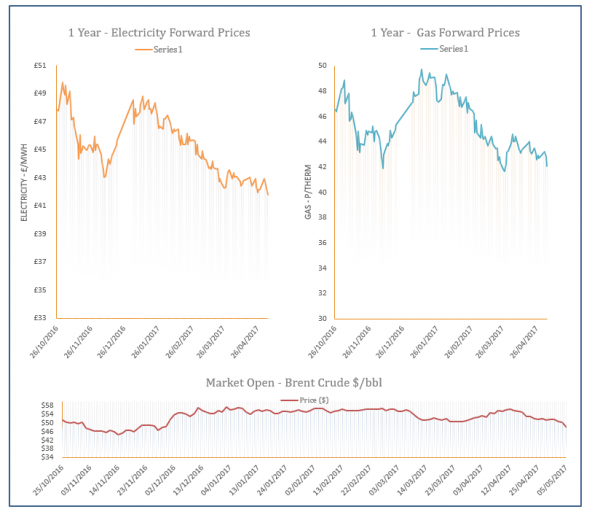
European gas prices fell yesterday, tracking the decline in Brent Oil prices. An oversupplied UK system weighed on the prompt on the back of an increase in Norwegian supply and a day-on-day drop in gas demand.
Energy Market Analysis - 04-05-2017
4th May 2017 | Posted by: Natalie Ormrod | Market Analysis
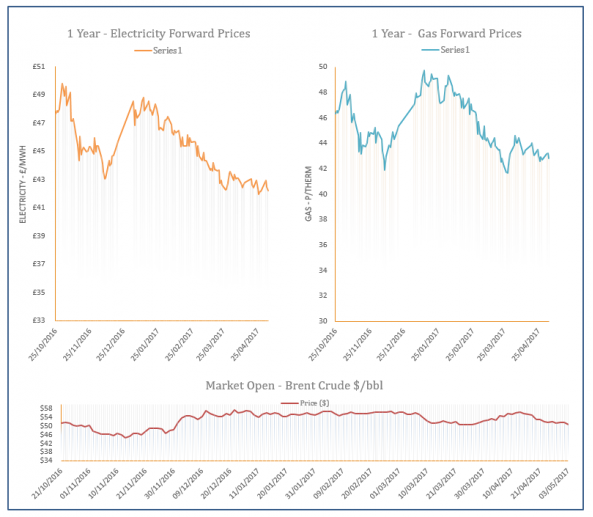
NBP day-ahead prices were down yesterday after Tuesday’s rally, on the back of an increase in Norwegian flows and lower UK exports to Belgium. Forecasts of a cold mid-May and higher than normal seasonal demand were countered by increased LNG flows.
Energy Market Analysis - 03-05-2017
3rd May 2017 | Posted by: Ben Crawley | Market Analysis
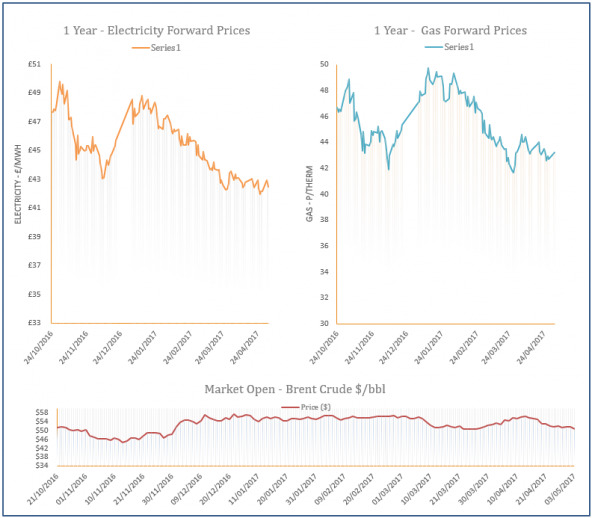
Gas prices maintained their recent bullish trend on Tuesday due largely to unplanned outages in Norway as well as decreased LNG send-outs; resulting in a short system. The near curve was particularly affected by reports that the middle of May will see temperatures below the seasonal norm.
Energy Market Analysis - 02-05-2017
2nd May 2017 | Posted by: Daniel Birkett | Market Analysis
Gas prices posted gains towards the end of Friday’s session with cold temperatures contributing to above average demand levels. A drop in storage injections also provided additional strength to the Day-Ahead contract. Meanwhile, oil prices were rather volatile and helped to support contracts on the far-curve.