Energy Market Analysis - 04-08-2016
4th August 2016 | Posted by: Daniel Birkett | Market Analysis
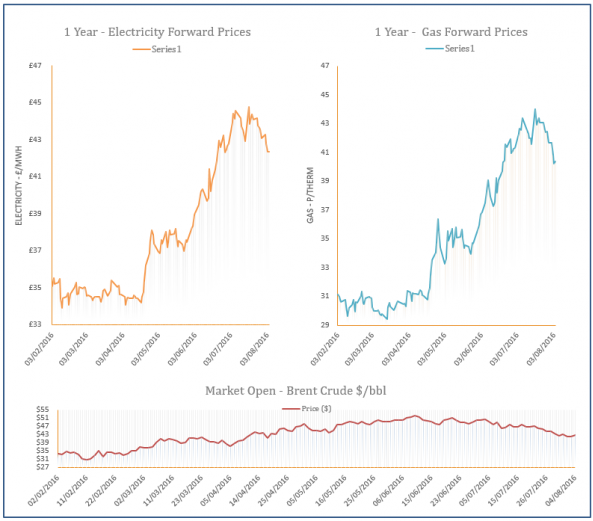
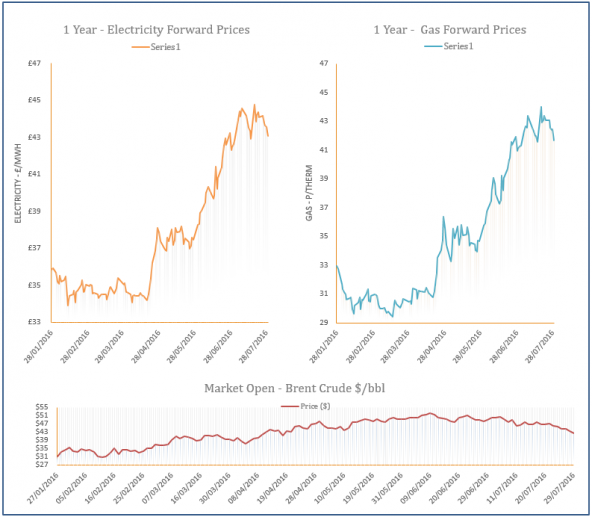
Demand for gas-fired power generation fell yesterday as wind power rose significantly, providing downward pressure on the near-curve. Prompt contracts moved down despite a drop in Norwegian flows and the start of maintenance at UKCS facilities, while a rebound in oil prices limited the losses on the far-curve.
Energy Market Analysis - 03-08-2016
3rd August 2016 | Posted by: Daniel Birkett | Market Analysis
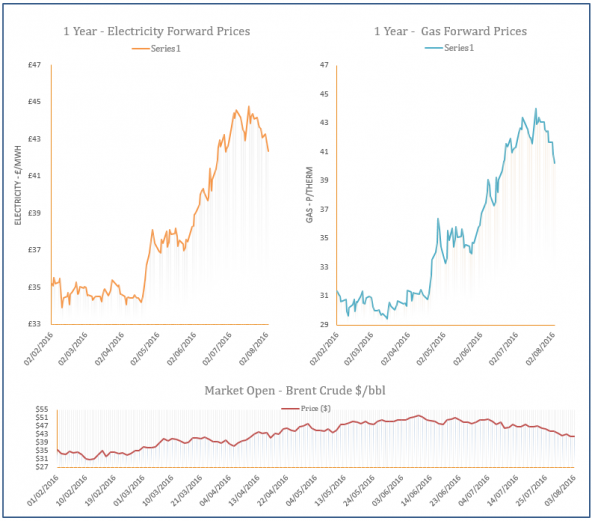
Gas prices continued to move down during Tuesday’s session despite weaker imports from Norway and the start of maintenance at the Britannia gas field. Elsewhere, a rise in Russian gas flows via Ukraine helped to weigh on European prices which also applied downward pressure on some corresponding UK contracts. Meanwhile, Brent recorded another loss which resulted in further downward movement on the far-curve.
Energy Market Analysis - 02-08-2016
2nd August 2016 | Posted by: Daniel Birkett | Market Analysis
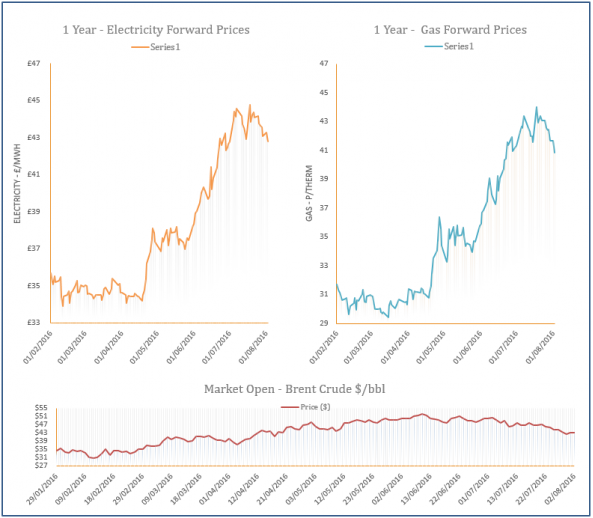
Falling oil prices helped to pressure down contracts on the far-curve yesterday although movement on the prompt was bullish due to a drop in Norwegian supply and the start of scheduled maintenance work at facilities in the UK; however, another drop in exports to Belgium via the IUK pipeline helped to limit some of the gains.
Energy Market Analysis - 01-08-2016
1st August 2016 | Posted by: Daniel Birkett | Market Analysis
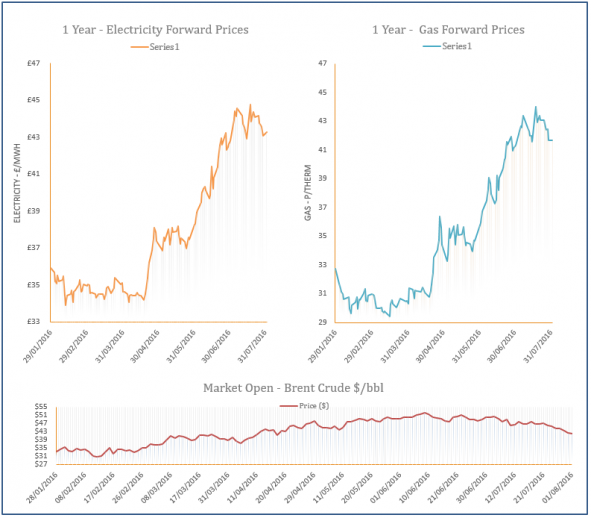
Gas contracts decreased on Friday with improved supply levels helping to weigh on the near-curve and weak oil contributing to bearish movement further out. Norwegian imports into the UK increased as a couple of outages were resolved and this resulted in a long UK gas system.
Energy Market Analysis - 29-07-2016
29th July 2016 | Posted by: Daniel Birkett | Market Analysis
Gas contracts moved down on Thursday as oil prices continued to plummet and Norwegian imports into the UK increased. Flows via the Langeled pipeline rose by 35mcm as outages at Norwegian facilities were resolved, leading to an oversupplied UK gas system. This improved supply picture resulted in strong losses on the near-curve, although a weaker Pound limited some of the downward movement.


