


Energy Market Analysis - 17-03-2016
17th March 2016 | Posted by: Daniel Birkett | Market Analysis
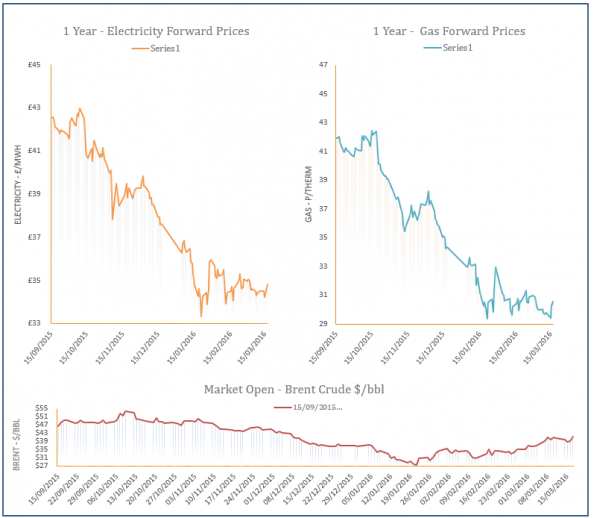
Gas prices increased yesterday morning as a number of unplanned outages reduced flows into the UK, however there was some downward movement in the afternoon as storage withdrawals helped to balance the system. The gains were more prominent on the far-curve rather than the prompt with further upward pressure coming from rising Brent.

Energy Market Analysis - 16-03-2016
16th March 2016 | Posted by: Daniel Birkett | Market Analysis
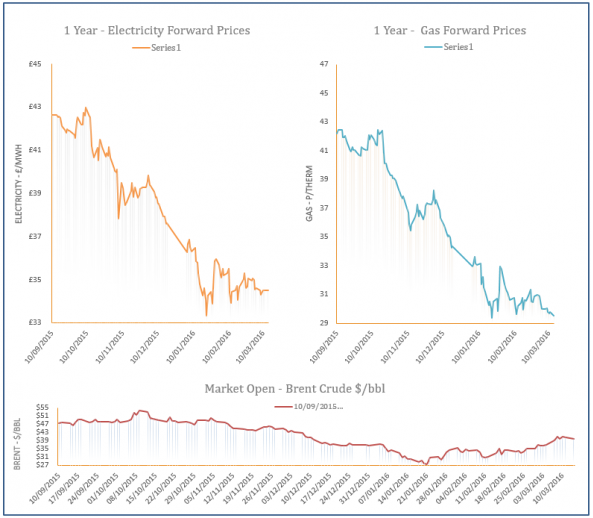
Low wind production resulted in a rise in gas-fired power generation on Tuesday which lifted demand levels, leading to a series of gains across the near gas curve. However, contracts further along the curve continued to soften with a bearish oil market the main influencing factor.

Energy Market Analysis - 15-03-2016
15th March 2016 | Posted by: Daniel Birkett | Market Analysis
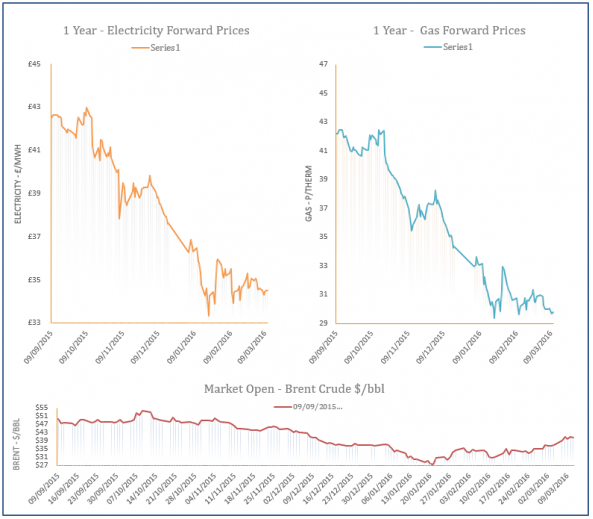
The UK gas system was balanced yesterday despite a drop in LNG send-outs as the Bacton Seal terminal returned online which improved UK production; this helped contracts across the near-curve post losses. Contracts also softened further along the curve as oil and coal prices displayed a decrease.
Energy Market Analysis - 14-03-2016
14th March 2016 | Posted by: Daniel Birkett | Market Analysis
The gas curve displayed mixed movement on Friday as there was little change to fundamentals and the market volatility caused by Thursday’s ECB meeting settled down. The UK gas system opened long which helped contracts on the near-curve shed from their price, while strong Brent resulted in some gains further out.
Energy Market Analysis - 11-03-2016
11th March 2016 | Posted by: Daniel Birkett | Market Analysis
A lower demand forecast for the next few days helped to weigh on near-curve gas contracts yesterday. Contracts were unaffected by a drop in LNG send-outs which resulted in a short UK gas system, with higher Norwegian and Dutch flows improving the short term supply outlook. Movement further along the curve was generally mixed with direction coming from volatility on the oil and currency markets.