


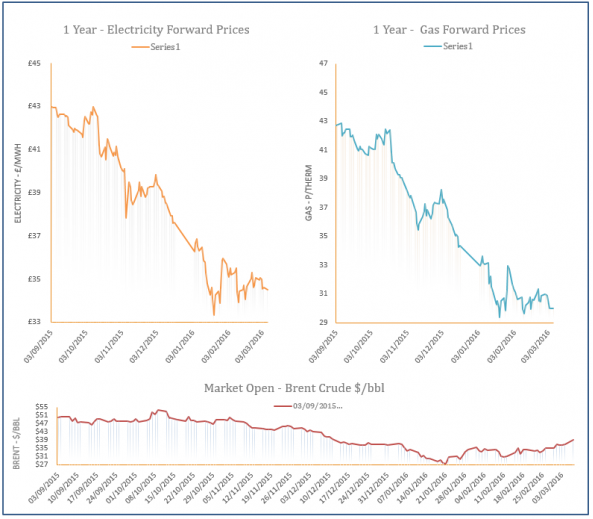
Energy Market Analysis - 10-03-2016
10th March 2016 | Posted by: Daniel Birkett | Market Analysis
Most gas contracts decreased yesterday afternoon as supply levels were comfortable and slightly milder temperatures led to a drop in demand. LNG send-outs increased from 38mcm to 66mcm with two deliveries expected to arrive in the UK this week, resulting in an oversupplied system. A rise in oil prices helped to support some contracts further along the curve but overall sentiment remained bearish.
Energy Market Analysis - 09-03-2016
9th March 2016 | Posted by: Daniel Birkett | Market Analysis
A mild weather forecast and a bearish oil market resulted in downward movement on the gas curve yesterday afternoon. Brent initially opened at its highest level since November but fell throughout the session, with the downward sentiment transferring to the gas market. Elsewhere, the supply picture was slightly weaker than previous sessions which helped to restrict some of the losses.
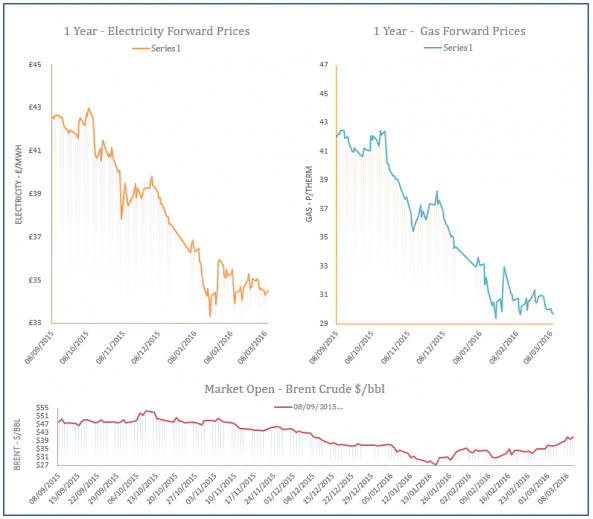
Energy Market Analysis - 08-03-2016
8th March 2016 | Posted by: Daniel Birkett | Market Analysis
Near-curve gas prices displayed mixed movement yesterday, as a lower demand forecast weighed on some contracts, while a drop in Norwegian flows and weaker Dutch production supported others. The milder weather outlook for the coming days and healthy stocks should help to pressure down the front of the curve this week but rising Brent continued to lift contracts further out.
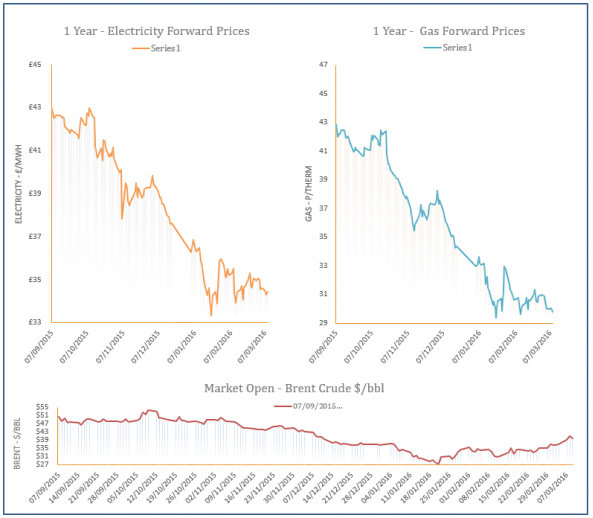
Energy Market Analysis - 07-03-2016
7th March 2016 | Posted by: Daniel Birkett | Market Analysis
Gas prices moved down on Friday despite strong demand as temperatures for the second half of March were forecast to be mild, while supply levels also remained healthy. Higher imports from Norway and Holland resulted in a long gas UK system although an unplanned outage at the Rough storage facility limited some of the losses on the near-curve. Downward movement was also visible on the far-curve despite rising Brent, as contracts were influenced by the weaker demand outlook.
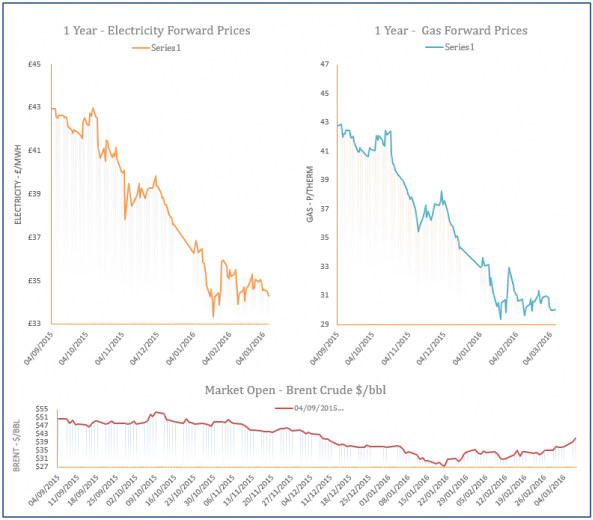
Energy Market Analysis - 04-03-2016
4th March 2016 | Posted by: Daniel Birkett | Market Analysis
Day-Ahead gas displayed an increase yesterday afternoon following an outage at the Rough storage facility which tightened the UK gas system. However, the overall supply picture remained comfortable which helped the rest of the near-curve display losses. Downward movement further along the curve was slightly restricted by stronger Brent.