


Apollo Energy publishes a daily energy market analysis, focusing on the gas, power and oil markets including a commentary on how the markets close and open. Our analysis provides insight on how the markets are performing and also considers various factors which could dictate price changes in the future.
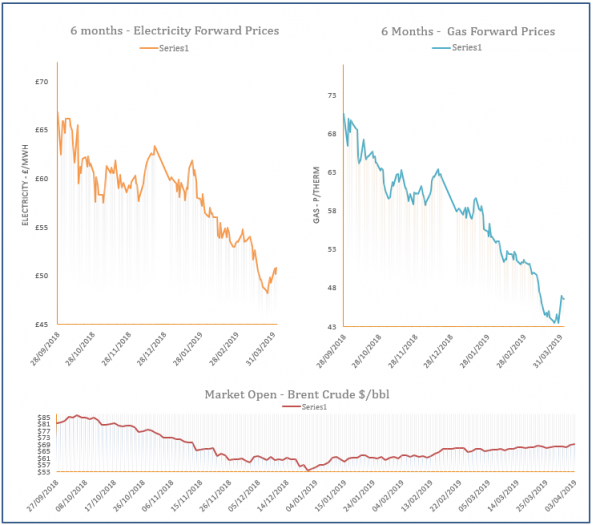
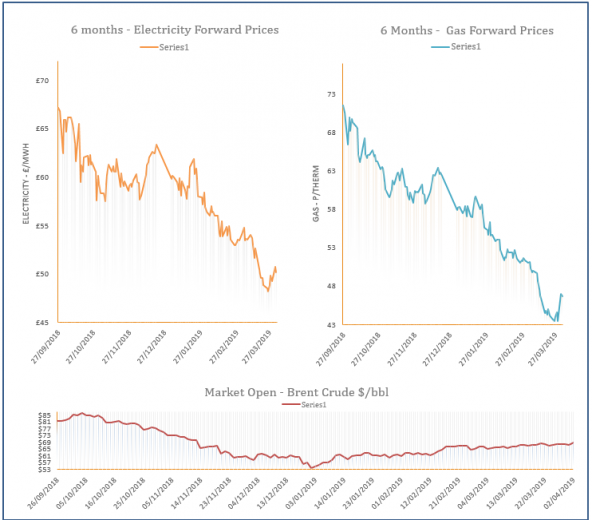
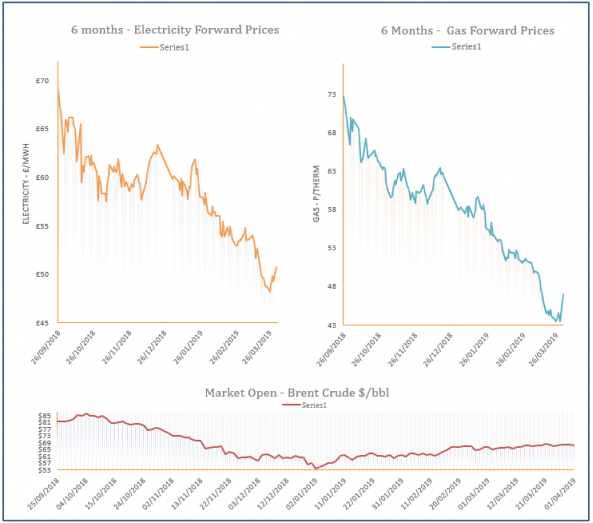
The analysis also contains a graph which tracks the one-year forward price of both gas and electricity as well as changes to Brent crude oil.
Energy Market Analysis – 03-04-2019
3rd April 2019 | Posted by: Daniel Birkett | Market Analysis
Near-curve gas prices decreased on Tuesday with the help of an oversupplied system and a strong rise in LNG send-outs, following fresh deliveries to the UK. Coal prices also weakened which helped to weigh on contracts further along the curve.

ESO targets zero carbon operations by 2025
3rd April 2019 | Posted by: Daniel Birkett | Industry News
The National Grid Electricity System Operator (ESO) has revealed that it will be capable of operating the UK electricity system with zero carbon emissions by 2025.
Energy Market Analysis – 02-04-2019
2nd April 2019 | Posted by: Daniel Birkett | Market Analysis
The first day of summer trading saw numerous losses on the gas curve yesterday, with an oversupplied system weighing on spot prices. A healthy LNG outlook provided additional bearish pressure, although a rise in oil markets limited downward movement further out.
Energy Market Analysis – 01-04-2019
1st April 2019 | Posted by: Daniel Birkett | Market Analysis
The April, Q-2 and Summer-19 contracts traded down before their expiry on Friday. The rest of the curve also decreased with direction coming from weaker coal and carbon markets, although the larger losses were seen on the power curve.