


Energy Market Analysis – 30-04-2019
30th April 2019 | Posted by: Daniel Birkett | Market Analysis
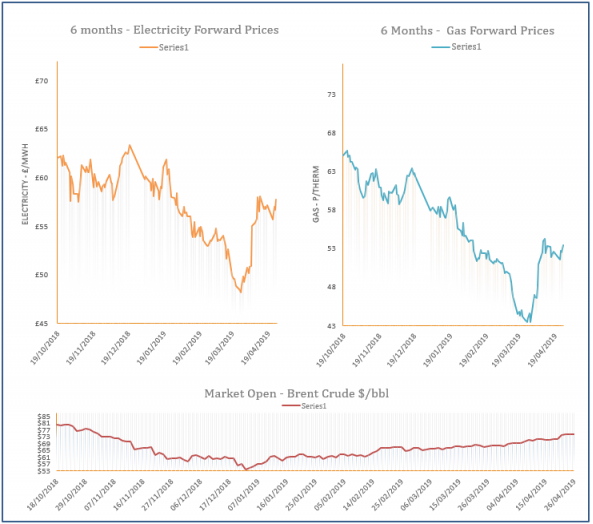
Trading on gas markets was quite lively yesterday but prices still ended the session almost unchanged. Commodity markets moved in different directions which created mixed sentiment, while short-term fundamentals are healthy, limiting upward movement on the near-curve.

Energy Market Analysis – 29-04-2019
29th April 2019 | Posted by: Daniel Birkett | Market Analysis
Power prices are stable-to-bearish this morning, although weak renewables have helped the prompt climb higher. A mild weather outlook has helped towards bearish movement on the near-curve, while contracts further out continue to follow weakening commodity markets.
Energy Market Analysis – 26-04-2019
26th April 2019 | Posted by: Daniel Birkett | Market Analysis
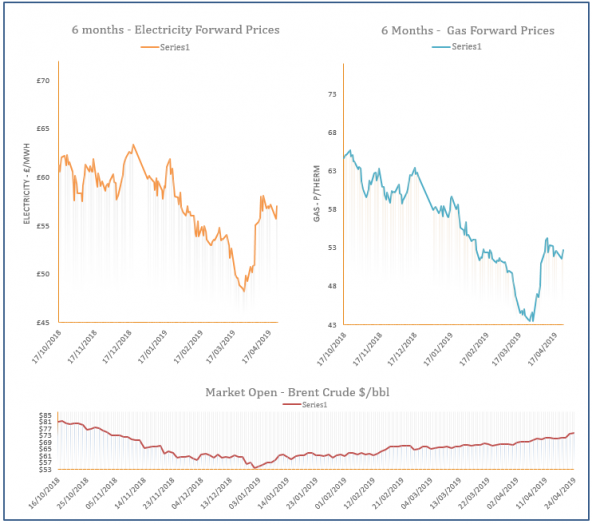
Gas prices displayed little movement during Thursday’s session, showing only minor gains by the day’s close. European energy markets traded slightly down, with coal and carbon markets recorded additional losses, providing resistance on the far-curve.

Energy Market Analysis – 25-04-2019
25th April 2019 | Posted by: Daniel Birkett | Market Analysis
Movement along the gas curve was mixed on Wednesday, although a drop in coal later in the session helped prices close down. Carbon also displayed a small decrease, while oil was unchanged. Meanwhile, the supply/ demand outlook was comfortable, with a steady influx of LNG deliveries expected in the coming weeks.
Energy Market Analysis – 24-04-2019
24th April 2019 | Posted by: Daniel Birkett | Market Analysis
Near-curve gas prices decreased on Tuesday as maintenance at the Interconnector prevented exports and resulted in a glut in supply. The losses filtered through to the far-curve earlier in the session but bullish oil and carbon markets provided support later on.