


Apollo Energy publishes a daily energy market analysis, focusing on the gas, power and oil markets including a commentary on how the markets close and open. Our analysis provides insight on how the markets are performing and also considers various factors which could dictate price changes in the future.
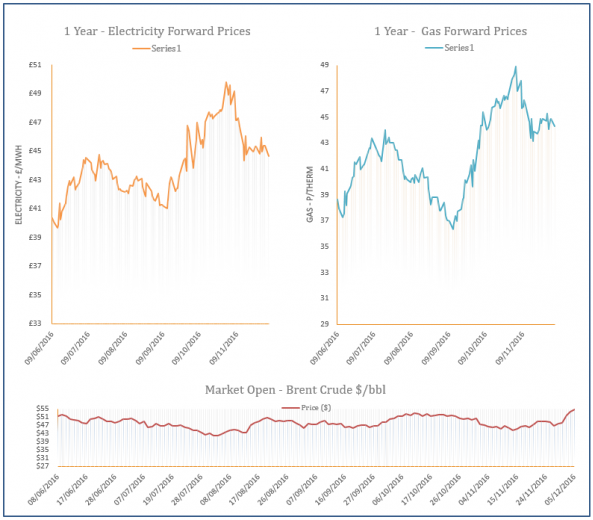
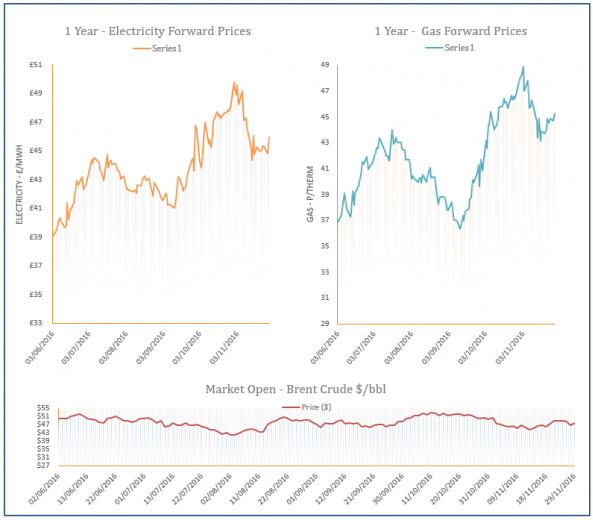
The analysis also contains a graph which tracks the one-year forward price of both gas and electricity as well as changes to Brent crude oil.
Energy Market Analysis - 05-12-2016
5th December 2016 | Posted by: Daniel Birkett | Market Analysis
A milder weather forecast for this week helped to pressure down near curve gas contracts on Friday as demand levels are set to fall. Withdrawals are also set to restart at the Rough storage facility on Friday, with a drop in coal and power prices also helping towards the losses.

Energy Market Analysis - 02-12-2016
2nd December 2016 | Posted by: Daniel Birkett | Market Analysis
Milder temperatures are expected in the UK next week and exports to Belgium decreased, helping towards losses on the near gas curve yesterday. The Pound also strengthened against the Euro as it is likely that the UK will be willing to pay to access the EU Common Market; further weighing on gas contracts.

Energy Market Analysis - 01-12-2016
1st December 2016 | Posted by: Daniel Birkett | Market Analysis
Centrica have announced that withdrawals at the Rough storage facility are set to resume on the 9th of December, resulting in downward movement across the near-curve yesterday morning. However, news from the OPEC meeting in Vienna led to rising oil prices, resulting in rebounds across the curve, with a cold weather forecast also providing on-going support.

Energy Market Analysis - 30-11-2016
30th November 2016 | Posted by: Daniel Birkett | Market Analysis
Gas prices displayed mixed movement on Tuesday with contracts at the front of the curve climbing higher as cold weather has pushed up demand, with below average temperatures expected to continue throughout December. Prices further along the curve were generally stable with oil prices failing to provide much support.
Energy Market Analysis - 29-11-2016
29th November 2016 | Posted by: Daniel Birkett | Market Analysis
Cold temperatures and reduced imports from Norway resulted in a tighter gas system yesterday which led to gains at the front of the curve. The drop in temperatures saw demand levels rise to 27% above the seasonal norm with a further increase expected today. Meanwhile, an outage at the Heimdal platform restricted Norwegian exports by 13mcm compared to last week’s average. Another drop in the Pound and gains on the oil market also helped to support gas contracts further out.