


Apollo Energy publishes a daily energy market analysis, focusing on the gas, power and oil markets including a commentary on how the markets close and open. Our analysis provides insight on how the markets are performing and also considers various factors which could dictate price changes in the future.
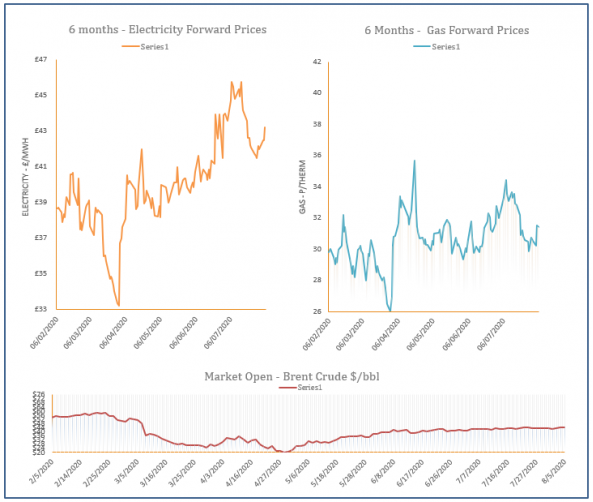
The analysis also contains a graph which tracks the one-year forward price of both gas and electricity as well as changes to Brent crude oil.
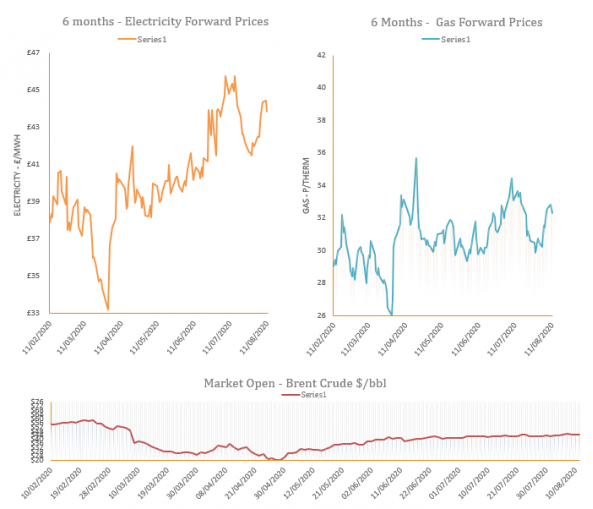
Energy Market Analysis - 11-08-2020
11th August 2020 | Posted by: Rebecca Haughton | Market Analysis
Gas prices sank yesterday in both the UK and on the continent as an uptick in LNG cargos was announced and global gas prices pulled back. Coal also retreated making fuel for power generation cheaper. Oil and carbon made gains yesterday.
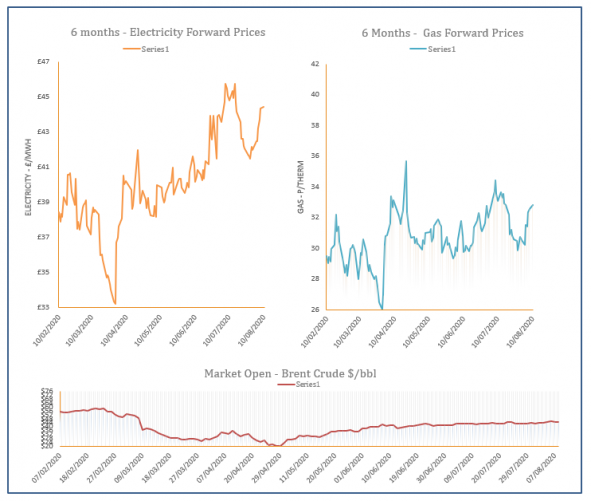
Energy Market Analysis – 10-08-2020
10th August 2020 | Posted by: Lawrence Carson | Market Analysis
Gas prices closed out Friday broadly unchanged in both the UK and on the continent. Commodities displayed mixed movement as oil fell, coal gained and carbon was unchanged.
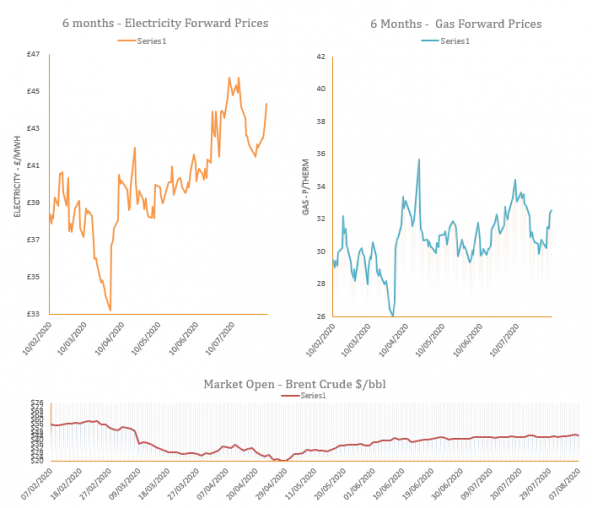
Energy Market Analysis - 07-08-2020
7th August 2020 | Posted by: Rebecca Haughton | Market Analysis
Gas prices rose for a fourth consecutive day, albeit with smaller gains on forward contracts. The Day-Ahead and two front months remained very strong.
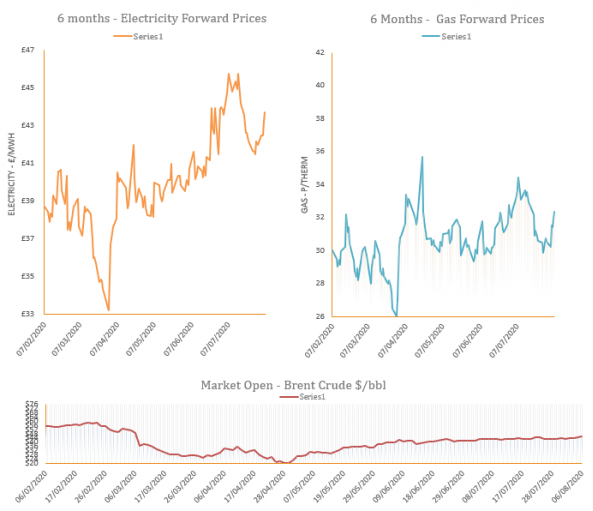
Energy Market Analysis - 06-08-2020
6th August 2020 | Posted by: Rebecca Haughton | Market Analysis
Gas prices continued their ascent yesterday, however the air may be getting thinner as the day on day increase slowed considerably. Part of the lift came from a gain in oil prices, coupled with new highs in equities, coal and carbon were flat.
Energy Market Analysis – 05-08-2020
5th August 2020 | Posted by: Daniel Birkett | Market Analysis
Gas prices continued to move higher in Tuesday’s session as traders closed their short positions en masse. A rise in gas-fired power demand also offered support to the near curve, in addition to a rise in oil, carbon and coal.