


Energy Market Analysis – 29-11-2019
29th November 2019 | Posted by: Daniel Birkett | Market Analysis
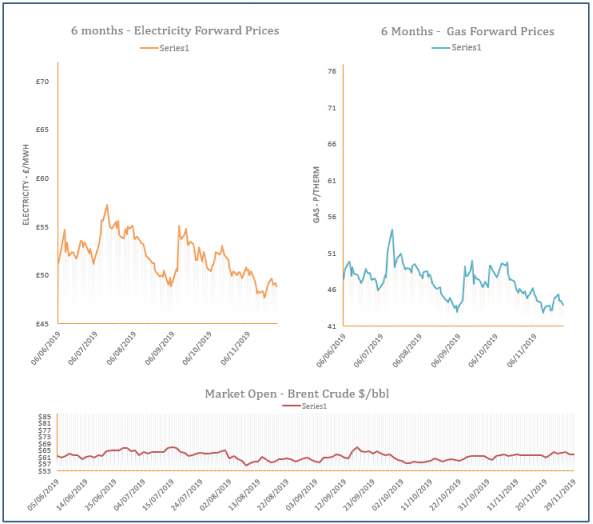
Gas prices decreased yesterday, with losses displayed from the prompt to the back of the curve. Temperatures are forecast to be above the seasonal norm for the start of December which will weigh on demand. Meanwhile, oil, coal and carbon markets weakened, offering further bearish pressure.
Energy Market Analysis – 28-11-2019
28th November 2019 | Posted by: Daniel Birkett | Market Analysis
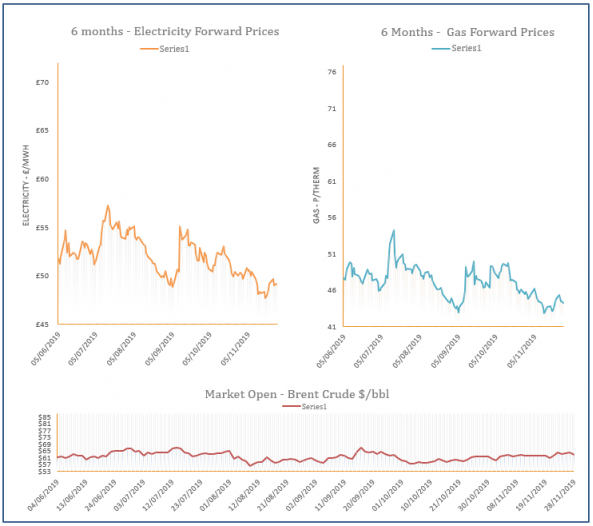
Gas prices moved higher across the curve during Wednesday’s session, with a significant drop in LNG send-outs providing bullish pressure on the near-curve. Increased storage injections and additional flows from the continent via the BBL & IUK pipelines were required to balance the system.

Energy Market Analysis – 27-11-2019
27th November 2019 | Posted by: Daniel Birkett | Market Analysis
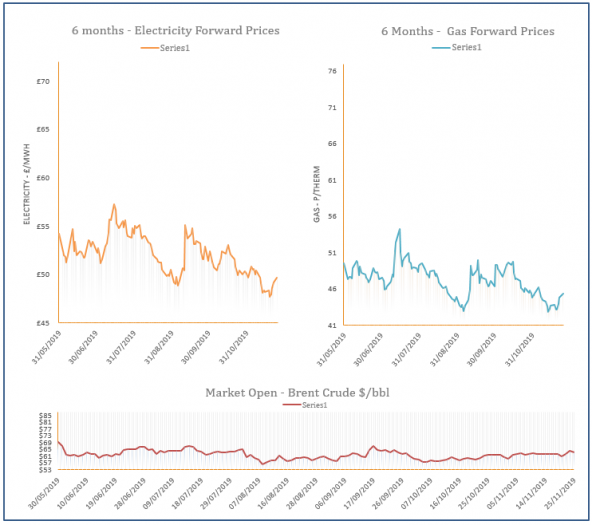
Gas prices decreased yesterday as a mild start to December is expected and wind levels are set to improve as we head towards the weekend, reducing reliance on gas-fired power. Further bearish sentiment was also provided by a drop in coal and carbon.

Energy Market Analysis – 26-11-2019
26th November 2019 | Posted by: Daniel Birkett | Market Analysis
Gas prices weakened yesterday, with most contracts being pressured down by a drop in coal and a stronger Pound. A rise in oil offered some support to prices at the back of the curve, while improved Norwegian flows and milder weather helped to weigh on the near-curve.
Energy Market Analysis – 25-11-2019
25th November 2019 | Posted by: Daniel Birkett | Market Analysis
Prompt gas prices ended Friday’s session at a premium with support provided by an undersupplied system, caused by tighter supply and an uptick in demand due to colder weather. Contracts further out were pushed higher by stronger coal, power and carbon.