


Energy Market Analysis – 08-11-2019
8th November 2019 | Posted by: Daniel Birkett | Market Analysis
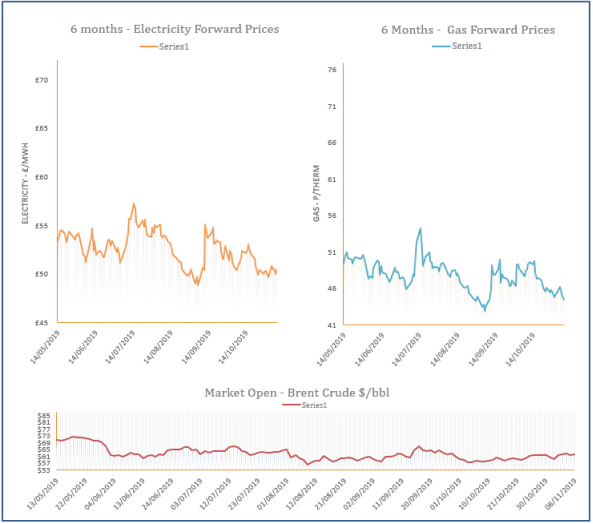
Gas prices at the front of the curve moved higher during Thursday’s session, while contracts further out continued to move down. Far-curve prices ignored a rise in coal and oil, while the near-curve found support from the colder weather outlook.
Energy Market Analysis – 07-11-2019
7th November 2019 | Posted by: Daniel Birkett | Market Analysis
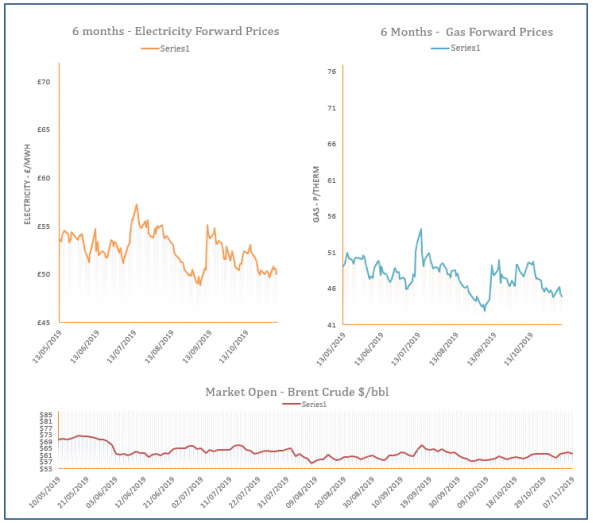
Gas prices were largely stable during Wednesday’s session but recorded losses towards the end of trading due to a strong decrease in oil prices. This had a knock-on effect on overall energy markets, with healthy supply adding to the bearish pressure at the front of the gas curve.
Energy Market Analysis – 06-11-2019
6th November 2019 | Posted by: Daniel Birkett | Market Analysis
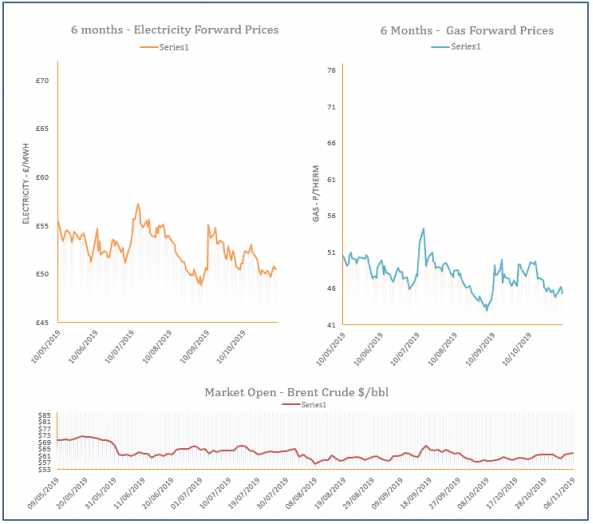
Gas prices continued to strengthen yesterday with support provided by an increase on overall energy markets, with oil & coal both moving higher. A colder weather outlook also added to the bullish sentiment, with an increased reliance on gas-fired power helping the prompt close at a premium.
Energy Market Analysis – 05-11-2019
5th November 2019 | Posted by: Daniel Birkett | Market Analysis
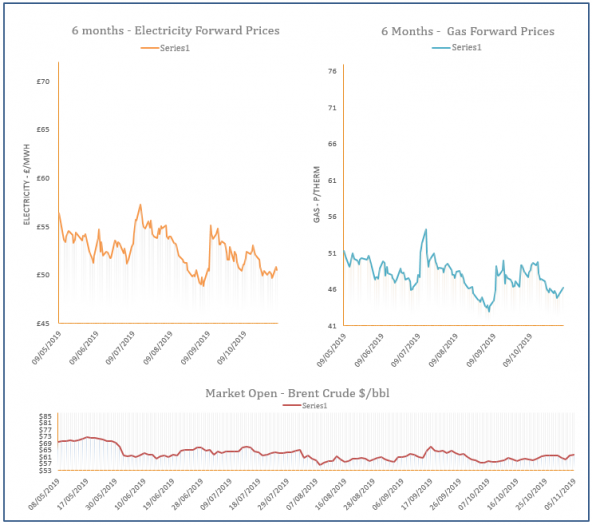
Gas prices were on the rise during Monday’s session due to a reduction in flows which led to an undersupplied system. Further support was provided by an expected drop in temperatures, while coal and oil markets also displayed small gains.
Energy Market Analysis – 04-11-2019
4th November 2019 | Posted by: Daniel Birkett | Market Analysis
Gas contracts added to their price on Friday, following bullish movement on overall energy markets. A rise in oil prices was the main driver of gas contracts, with a tighter supply picture offering additional support to the front of the curve.