


Energy Market Analysis –31-05-2019
31st May 2019 | Posted by: Daniel Birkett | Market Analysis
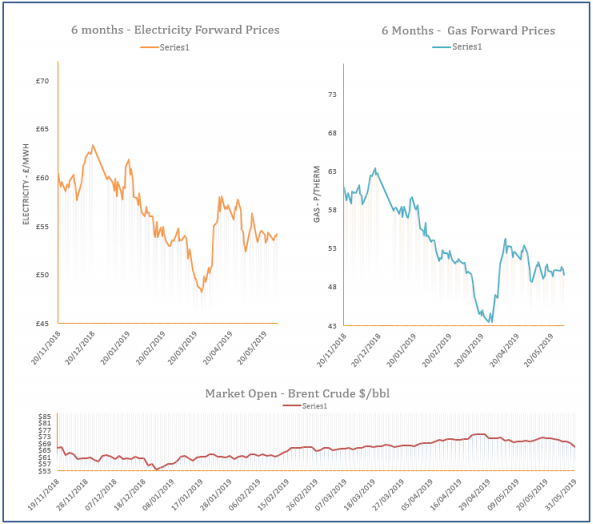
Gas prices moved down on Thursday, the losses were displayed across the curve, with the larger decreases recorded at the front. A surprise drop in oil helped to weigh on some prices, while the forecast for short term fundamentals was unchanged.
Energy Market Analysis –30-05-2019
30th May 2019 | Posted by: Daniel Birkett | Market Analysis
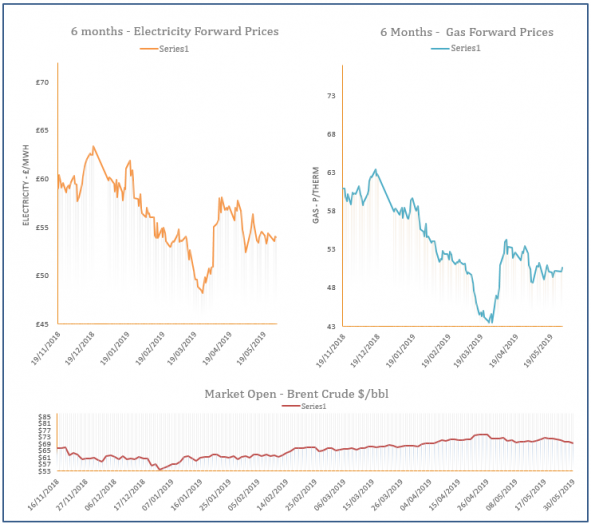
Near-curve gas prices decreased on Wednesday thanks to an oversupplied system, as milder weather reduced demand levels. The losses filtered through to the rest of the curve, with coal and oil markets also showing weakness.
Energy Market Analysis –29-05-2019
29th May 2019 | Posted by: Daniel Birkett | Market Analysis
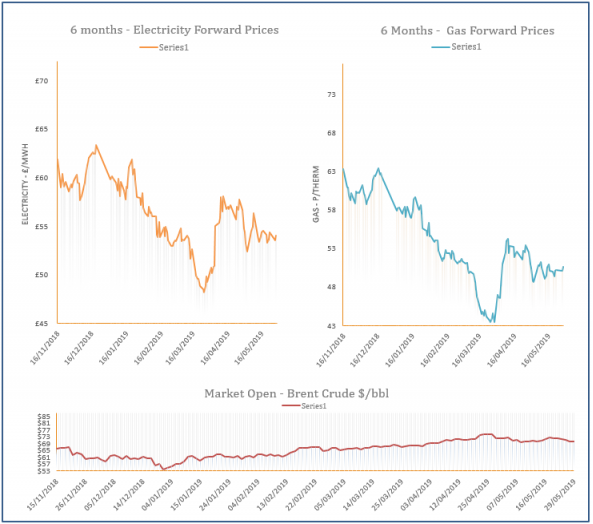
Gas prices climbed higher during Tuesday’s session despite little movement on coal, oil and carbon markets. Some support was provided by a potential strike at North Sea oil drilling facilities, with cooler temperatures also lifting demand in the UK.

Energy Market Analysis –28-05-2019
28th May 2019 | Posted by: Daniel Birkett | Market Analysis
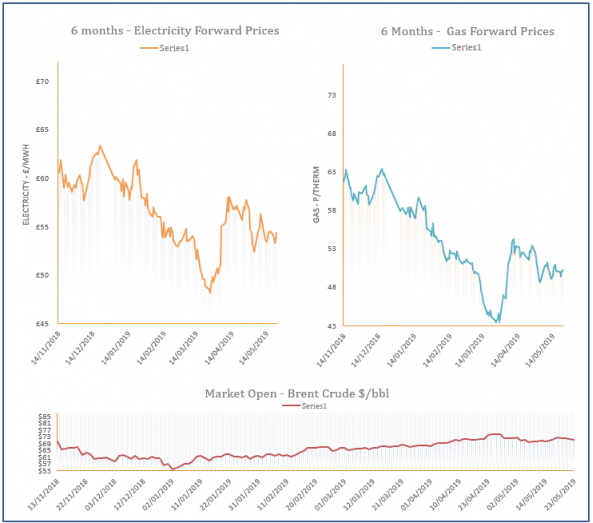
No trading took place yesterday due to the Bank Holiday weekend, while movement on Friday was generally bearish. Weaker flows from Norway moved the system closer to balance but an expected improvement in renewable power this week helped to weigh on the near-curve.
Energy Market Analysis –24-05-2019
24th May 2019 | Posted by: Daniel Birkett | Market Analysis
Gas prices displayed little change during Thursday’s session despite a long UK gas system and weaker commodities. The prompt weakened thanks to mild temperatures and stable renewables, while a drop in coal and carbon limited upward movement further out.