


Energy Market Analysis - 09-05-2019
9th May 2019 | Posted by: Lawrence Carson | Market Analysis
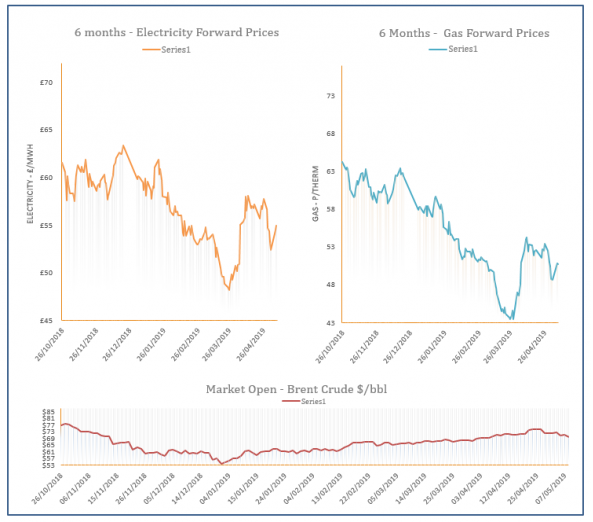
The majority of gas contracts made gains across the curve yesterday. Cold temperatures, lower power production from wind and rallying carbon prices were all responsible for pushing gas prices higher.
Energy Market Analysis - 08-05-2019
8th May 2019 | Posted by: Natalie Ormrod | Market Analysis
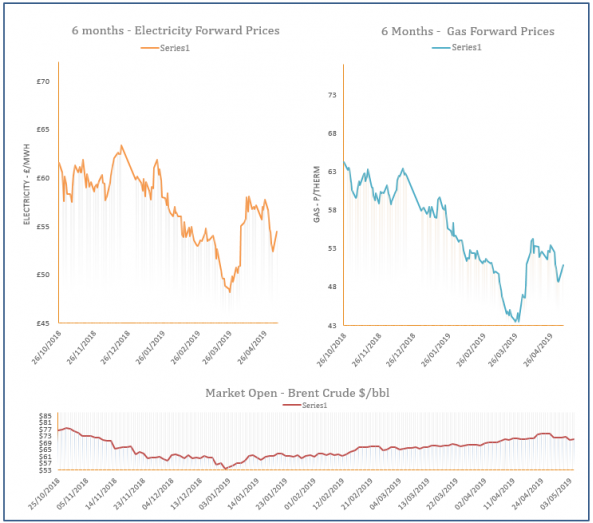
Trade on Gas was mixed yesterday with an early morning rally, by the afternoon the market turned which saw lower front curve and spot prices due to increasing wind output, rising temperatures and strength in Carbon.
Energy Market Analysis –07-05-2019
7th May 2019 | Posted by: Lawrence Carson | Market Analysis
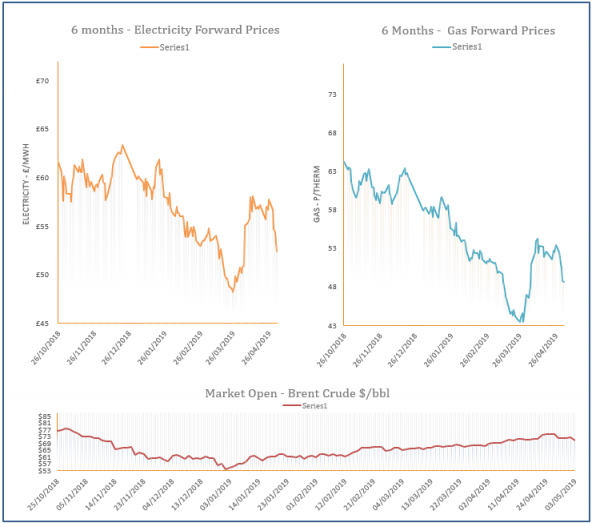
Slightly cooler temperatures than the seasonal norm meant gas prices gained strength across the curve on Friday. Support for the near curve came from Norwegian technical issues, whilst support further out was provided by a firming coal market.
Energy Market Analysis –03-05-2019
3rd May 2019 | Posted by: Daniel Birkett | Market Analysis
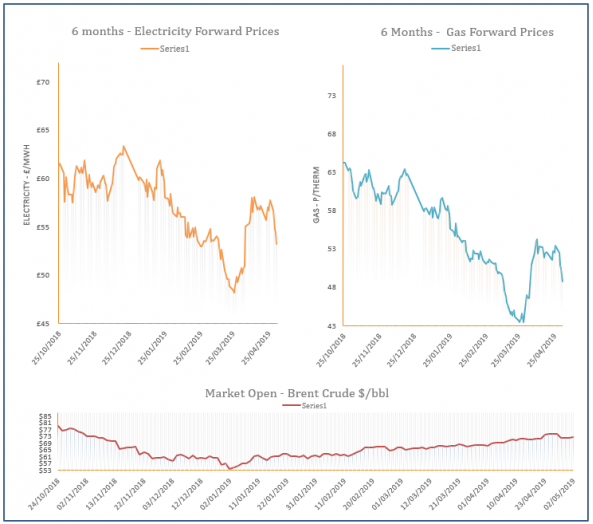
Near-curve gas prices climbed slightly higher yesterday due to an undersupplied system and a colder weather forecast for the weekend. Meanwhile, contracts further along the curve were pressured down by weaker oil, power and carbon markets.
Energy Market Analysis –02-05-2019
2nd May 2019 | Posted by: Daniel Birkett | Market Analysis
Gas prices moved down during yesterday’s session with bearish pressure provided by a drop in coal, carbon and power prices. An oversupplied system also helped to weigh on the near-curve, with numerous LNG deliveries arriving in the UK resulting in high send-outs.