


Energy Market Analysis – 30-09-2019
30th September 2019 | Posted by: Daniel Birkett | Market Analysis
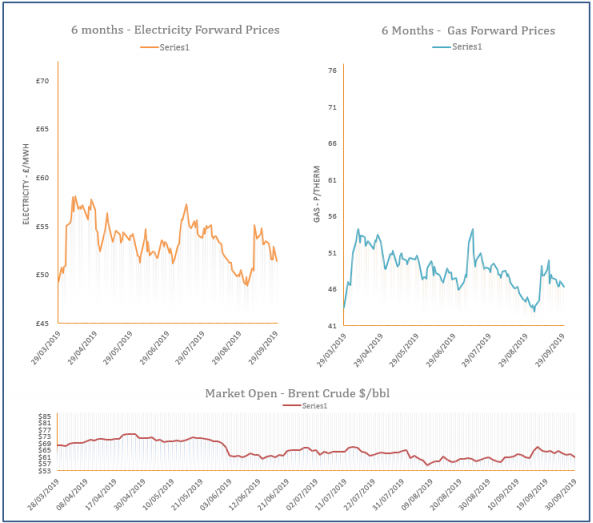
Gas prices moved down on Friday and followed the overall energy market, with oil and carbon displaying a loss. Oil prices were pressured down by the return on Saudi oil production, while the near-curve weakened on the back of a healthy LNG outlook.
Energy Market Analysis – 27-09-2019
27th September 2019 | Posted by: Daniel Birkett | Market Analysis
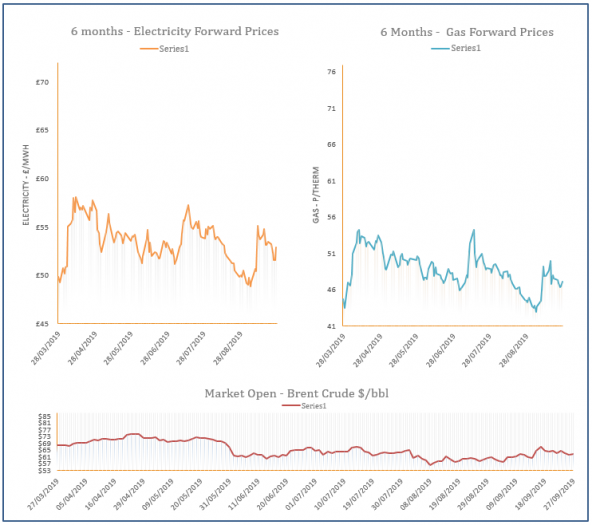
Gas prices increased yesterday ahead of the September contract’s expiry date. Traders looked to strengthen their positions ahead of new delivery dates and most of the gains were technical rather than caused by fundamentals or commodity markets.
Energy Market Analysis – 26-09-2019
26th September 2019 | Posted by: Daniel Birkett | Market Analysis
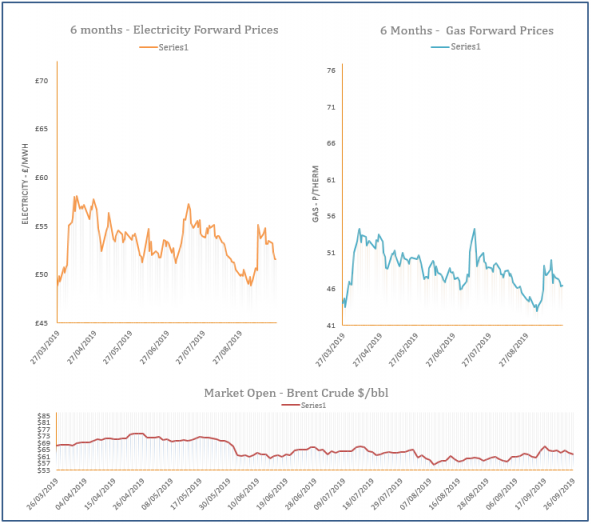
Gas contracts shed from their price on Wednesday with the larger losses displayed at the front of the curve. Commodity markets eased down, weighing on the gas curve, with a healthier supply outlook adding to the bearish pressure.
Energy Market Analysis – 25-09-2019
25th September 2019 | Posted by: Daniel Birkett | Market Analysis
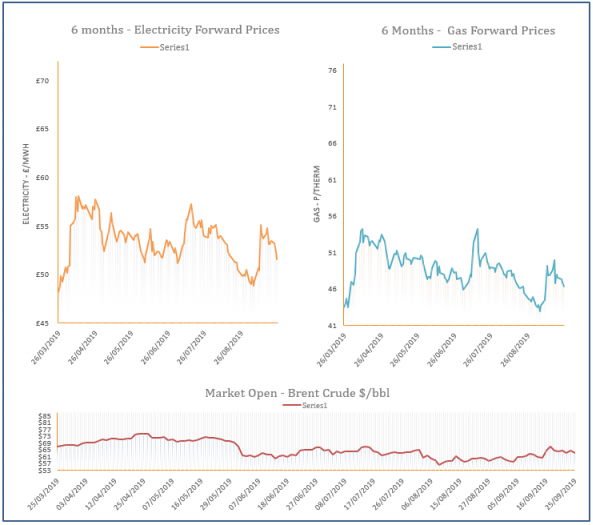
Far-curve gas prices moved down on Tuesday with bearish pressure provided by weaker coal, oil and carbon markets. Meanwhile, contracts at the front of the curve climbed slightly higher on the back of higher demand and a tighter system.
Energy Market Analysis – 24-09-2019
24th September 2019 | Posted by: Daniel Birkett | Market Analysis
Gas contracts traded down on Monday with Front-Month and seasonal contracts taking direction from weaker coal and carbon prices. Supply levels are also expected to improve in the coming weeks as Norwegian maintenance has ended and the LNG delivery schedule is healthy.