


Energy Market Analysis – 31-01-2020
31st January 2020 | Posted by: Daniel Birkett | Market Analysis
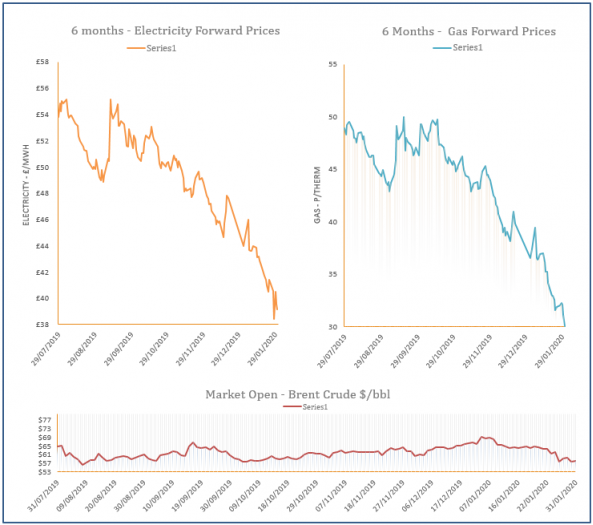
The majority of gas prices decreased yesterday as milder temperatures are expected, while wind generation is set to remain healthy until the weekend at least. Weaker coal, oil and carbon markets also helped to apply further downward pressure at the back of the curve.

Energy Market Analysis – 30-01-2020
30th January 2020 | Posted by: Daniel Birkett | Market Analysis
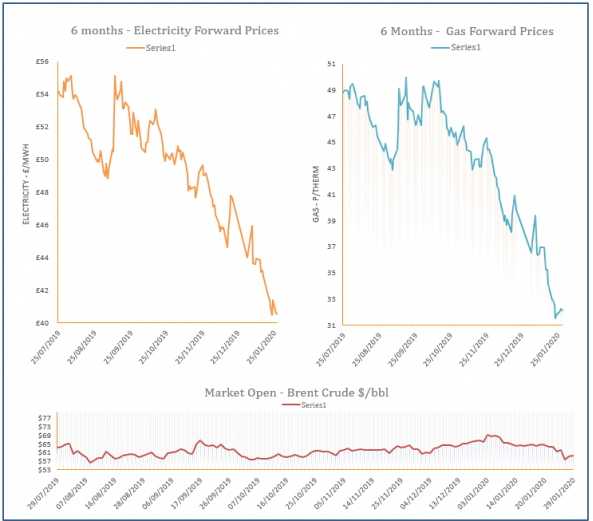
Gas prices decreased across the curve yesterday, erasing Tuesday’s gains. Prices followed the rest of the European energy complex, with coal, power and carbon markets all displaying losses. Further bearish pressure was provided by a milder weather outlook.
Energy Market Analysis – 29-01-2020
29th January 2020 | Posted by: Daniel Birkett | Market Analysis
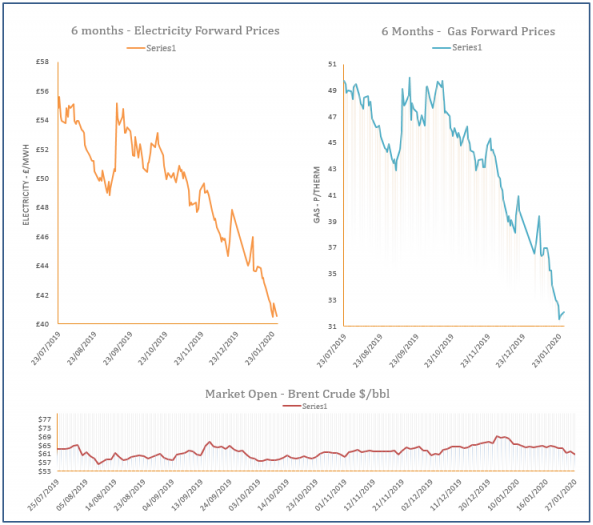
Gas prices found some support from an undersupplied system yesterday, with most contracts on the near curve displaying a gain. Coal and power markets also moved higher, while carbon was mostly stable.

Energy Market Analysis – 28-01-2020
28th January 2020 | Posted by: Daniel Birkett | Market Analysis
Gas prices displayed mixed movement throughout yesterday’s session and ended the day almost unchanged. The spread of the Coronavirus in China has caused concerns of an economic slowdown, offsetting bullish factors such as a colder weather outlook and undersupply.
Energy Market Analysis – 27-01-2020
27th January 2020 | Posted by: Daniel Birkett | Market Analysis
Gas prices decreased on Friday despite falling oil, with contracts instead finding direction from weaker carbon. An expected rise in wind generation at the start of this week also helped to weigh on the prompt as demand for gas-fired power would fall as a result.