


Energy Market Analysis – 10-01-2020
10th January 2020 | Posted by: Daniel Birkett | Market Analysis
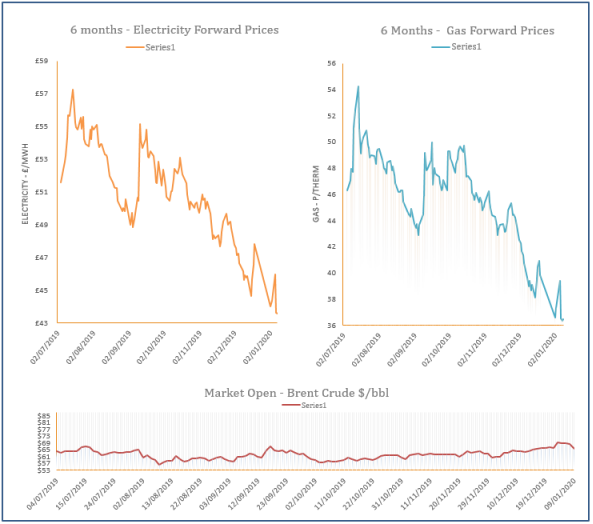
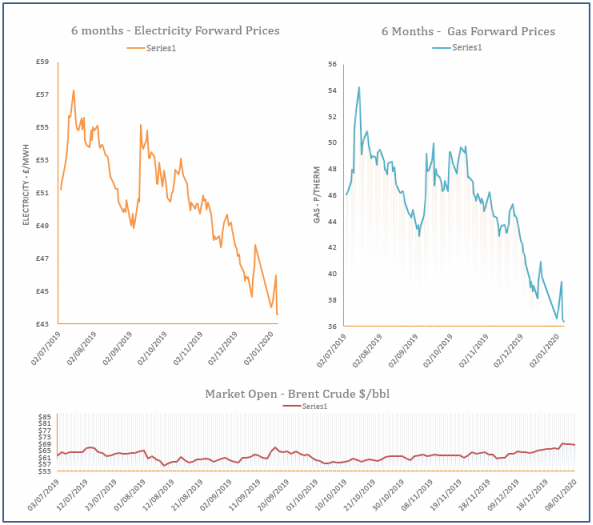
The UK gas system was undersupplied yesterday due to limited supply from Norway, offering some support to the near-curve. The latest weather forecasts also pointed towards a drop in temperatures as we approach the end of January. Meanwhile, far-curve prices moved higher as commodity markets were supportive.
Energy Market Analysis – 09-01-2020
9th January 2020 | Posted by: Daniel Birkett | Market Analysis
Gas prices stabilised during Wednesday’s session, showing only small fluctuations in either direction before settling around their opening price by the end of the day. A bearish turn on oil markets helped to weigh on prices, while the supply/ demand picture was little changed.
Energy Market Analysis – 08-01-2020
8th January 2020 | Posted by: Daniel Birkett | Market Analysis
Gas prices decreased during Tuesday’ session, erasing most of the gains recorded at the end of last week. Oil prices retraced slightly which eased the bullish pressure, although carbon was more resilient.

Energy Market Analysis – 07-01-2020
7th January 2020 | Posted by: Daniel Birkett | Market Analysis
Gas prices continued to rally higher yesterday morning, but slowly eased down as the session progressed. Contracts traded close to their previous closing price as any bullish pressure provided by the rise in oil prices faded.

Energy Market Analysis – 06-01-2020
6th January 2020 | Posted by: Daniel Birkett | Market Analysis
Gas prices moved higher on Friday as contracts displayed a rebound from the fresh lows displayed at the end of 2019. A drop in flows from Russia into mainland Europe had little impact on prices and instead the gas curve found support from stronger oil prices, following events in Iran.