


Energy Market Analysis – 24-12-2020
24th December 2020 | Posted by: Daniel Birkett | Market Analysis
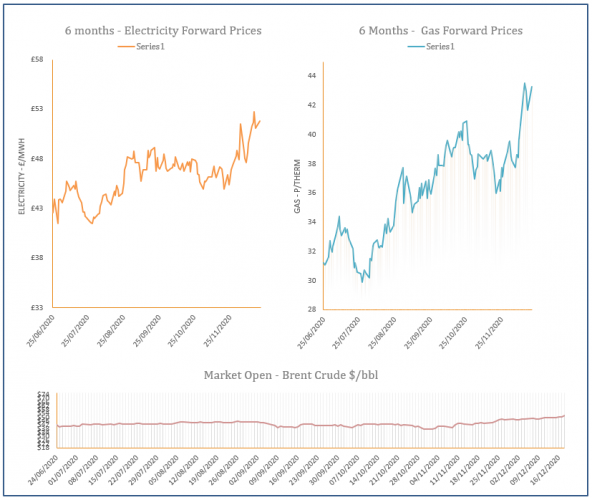
The majority of gas prices closed higher on Wednesday as demand levels are set to grow over the weekend and tighter supply is expected in January. Meanwhile, progress in terms of Brexit negotiations offered some optimism in the afternoon.

Energy Market Analysis – 23-12-2020
23rd December 2020 | Posted by: Daniel Birkett | Market Analysis
A lack of progress in regard to the UK’s exit from the EU and subsequent trade deals continued to support prices yesterday, combined with a tighter supply/ demand outlook for Q1-2021.

Energy Market Analysis – 22-12-2020
22nd December 2020 | Posted by: Daniel Birkett | Market Analysis
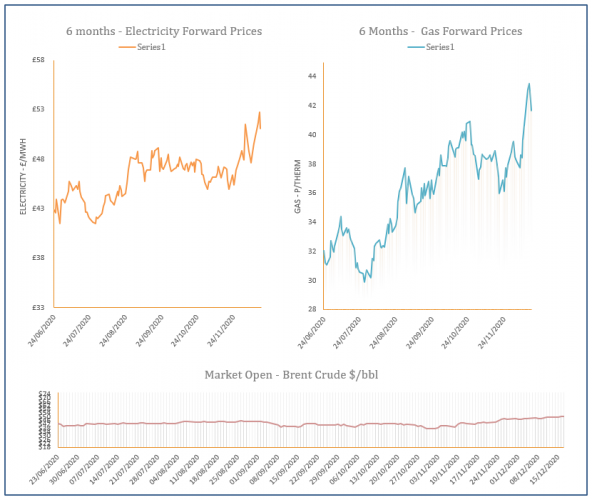
Sentiment was practically unchanged from last week with an expected drop in temperatures and on-going negotiations between the UK and the EU helping towards gains across the curve.
Energy Market Analysis – 21-12-2020
21st December 2020 | Posted by: Daniel Birkett | Market Analysis
Gas prices were pushed higher by the stalemate between the UK and the EU in regard to trade deal talks. A tighter demand outlook also offered further support to the curve, in addition to a rise in commodities.
Energy Market Analysis – 17-12-2020
17th December 2020 | Posted by: Daniel Birkett | Market Analysis
The system was oversupplied yesterday, resulting in losses across the near curve, with a healthy supply/ demand outlook for the remainder of the month adding to the bearish pressure.