


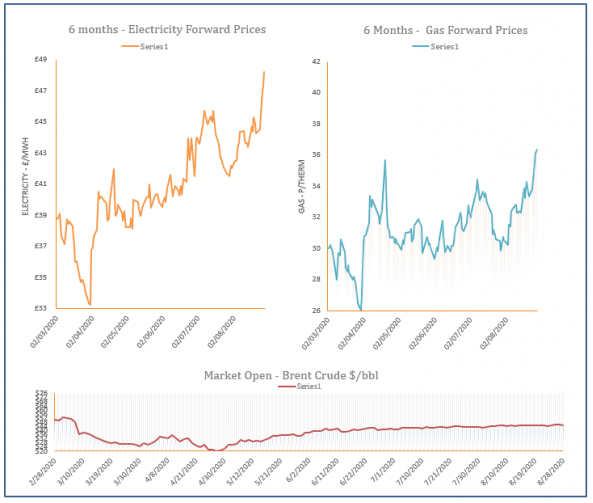
Energy Market Analysis – 28-08-2020
28th August 2020 | Posted by: Daniel Birkett | Market Analysis
Gas prices eased down yesterday following strong gains in previous sessions. Losses were displayed across the curve, with coal and power markets also correcting downward. An expected drop in demand today also weighed on the prompt, despite a short system.
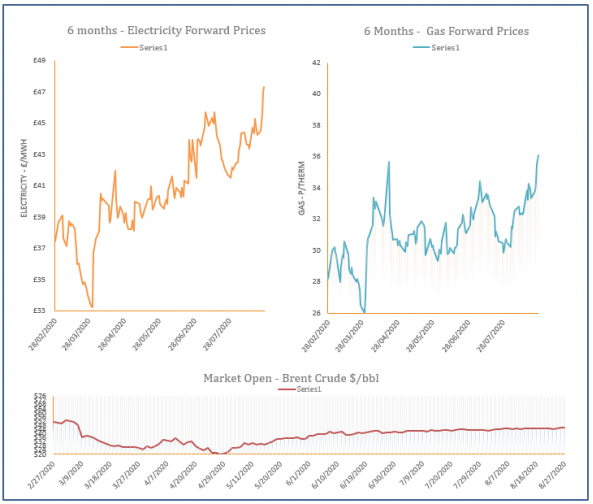
Energy Market Analysis – 27-08-2020
27th August 2020 | Posted by: Daniel Birkett | Market Analysis
Gas prices increased during Wednesday’s session, with a tighter supply/ demand picture offering support to the front of the curve. Further out, contracts were pushed higher by an increase in LNG prices, partly caused by a rise on US fuel markets.
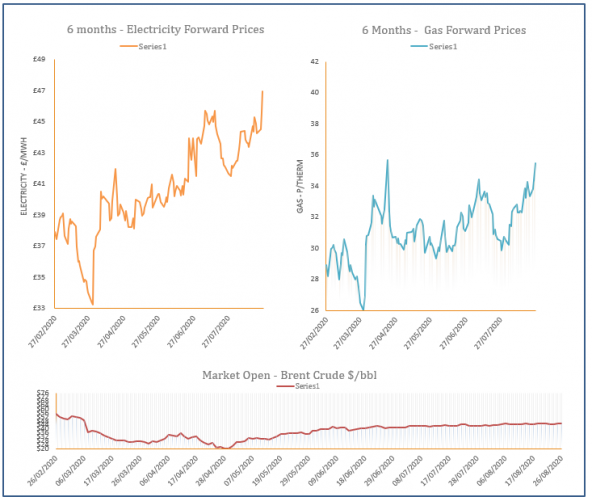
Energy Market Analysis – 26-08-2020
26th August 2020 | Posted by: Daniel Birkett | Market Analysis
Gas contracts rallied higher yesterday, with hurricanes in the US resulting in stronger fuel prices which transferred to global markets. LNG deliveries to Europe also remained low and short-term demand forecasts are higher due to cooler weather.

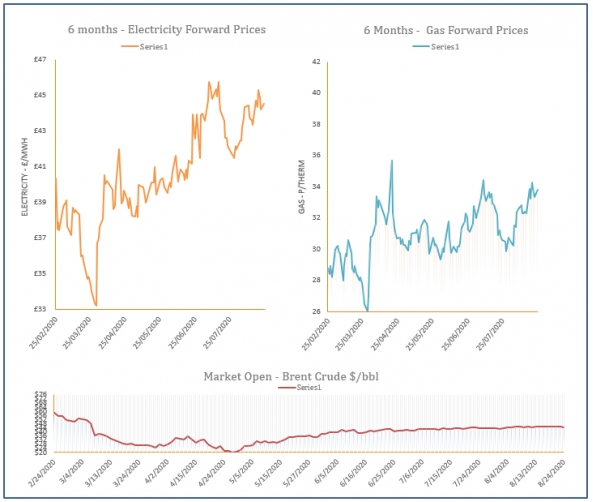
Energy Market Analysis – 25-08-2020
25th August 2020 | Posted by: Daniel Birkett | Market Analysis
Gas prices displayed a rebound during Monday’s session, following strong losses on Friday. An undersupplied system offered support to the prompt and the front of the curve. Carbon increased by almost €2, while coal and oil also ticked higher, lifting the far curve.
Energy Market Analysis – 24-08-2020
24th August 2020 | Posted by: Daniel Birkett | Market Analysis
Gas prices decreased on Friday, following the broader energy complex, with coal, oil, carbon and power all recording losses. The system was oversupplied as gas-fired power demand was down due to very strong wind generation.