


Energy Market Analysis – 12-02-2021
12th February 2021 | Posted by: Daniel Birkett | Market Analysis
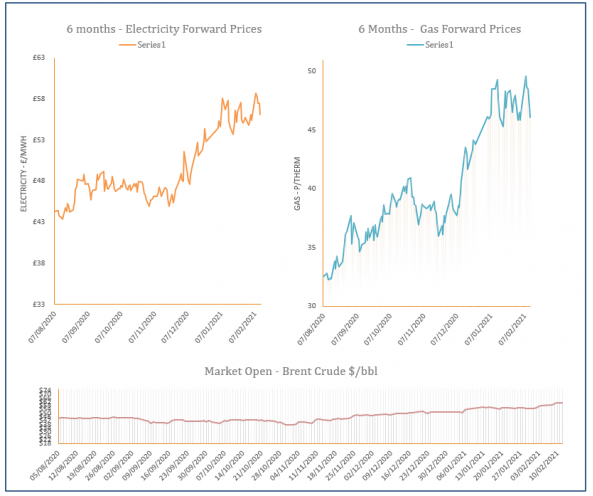
Gas prices eased down yesterday with expectations of a drop in demand next week. LNG send-outs remained high with more deliveries expected to arrive in the UK as European countries take advantage of cheap Asian prices.

Energy Market Analysis – 11-02-2021
11th February 2021 | Posted by: Daniel Birkett | Market Analysis
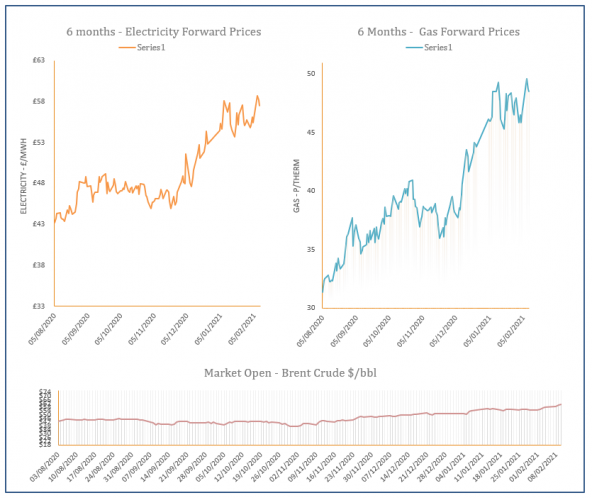
A long system and an expected rise in temperatures next week helped gas contracts shed from their price on Wednesday, although bullish oil and fuel markets limited losses further along the curve.
Energy Market Analysis – 10-02-2021
10th February 2021 | Posted by: Daniel Birkett | Market Analysis
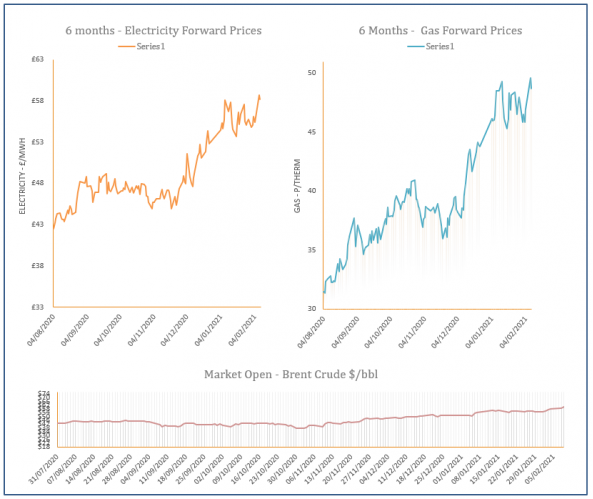
An oversupplied system and a weaker demand forecast for the end of the week resulted in losses along the gas curve on Tuesday, although fuel markets continued to strengthen, limiting some losses on longer dated contracts.
Energy Market Analysis – 09-02-2021
9th February 2021 | Posted by: Daniel Birkett | Market Analysis
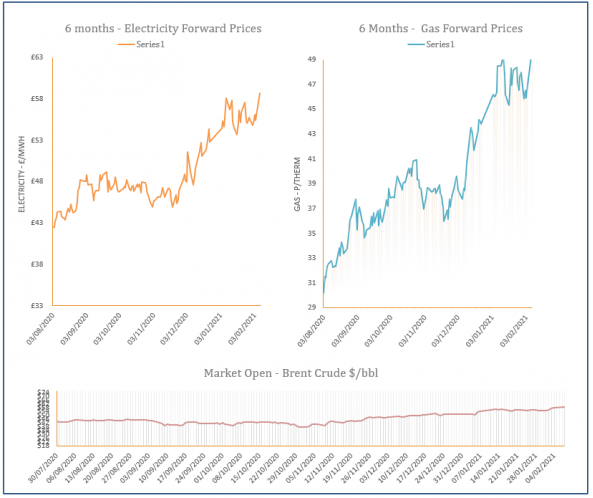
Expectations of cold weather dictated the near gas curve yesterday, with demand levels forecast to climb well above the seasonal norm, while a drop in renewable power also increases reliance on CCGT generation.
Energy Market Analysis – 08-02-2021
8th February 2021 | Posted by: Daniel Birkett | Market Analysis
Despite an oversupplied system, gas contracts added to their price on Friday as cold temperatures were forecast for this week which will test supply. Bullish oil also contributed to gains, with recoveries displayed across all fuel markets.