


Apollo Energy publishes a daily energy market analysis, focusing on the gas, power and oil markets including a commentary on how the markets close and open. Our analysis provides insight on how the markets are performing and also considers various factors which could dictate price changes in the future.
The analysis also contains a graph which tracks the one-year forward price of both gas and electricity as well as changes to Brent crude oil.
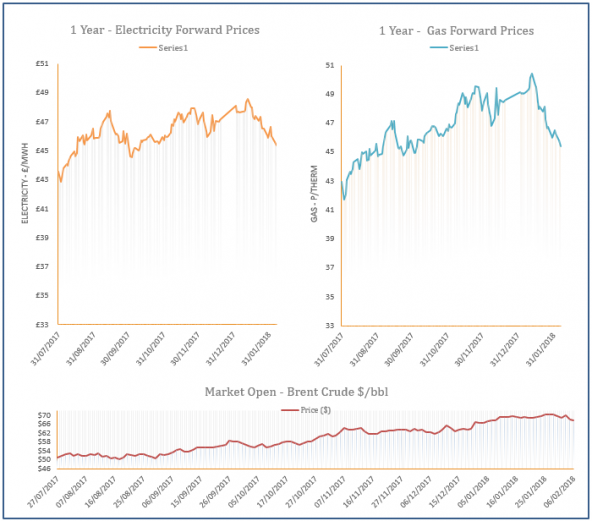
Energy Market Analysis - 06-02-2018
6th February 2018 | Posted by: Daniel Birkett | Market Analysis
Gas prices decreased during Monday’s session as the current cold spell is only expected to last until the weekend and the impact on storage levels should be minimal; a mild January has kept storage levels above the seasonal norm. Contracts further along the curve were pressured down by losses on the oil market, with bearish sentiment provided by an expected rise in global interest rates.
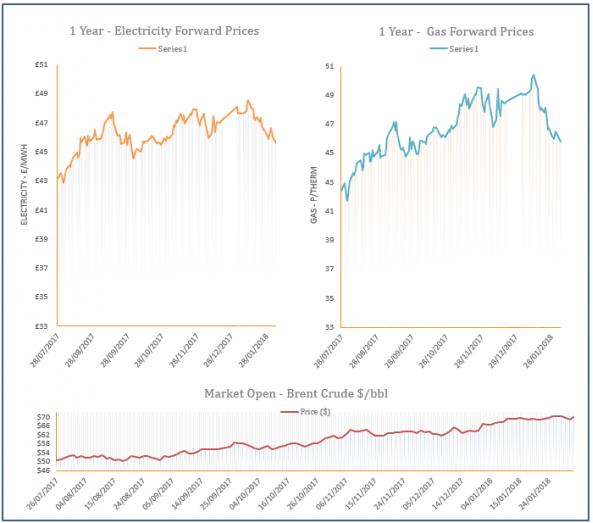
Energy Market Analysis - 05-02-2018
5th February 2018 | Posted by: Daniel Birkett | Market Analysis
Gas prices climbed higher on Friday as a significant drop in wind levels and cold temperatures were expected today, increasing demand levels. IUK flows improved slightly and this helped to balance the system. Meanwhile, oil prices strengthened and this helped contracts on the far-curve close at a premium.
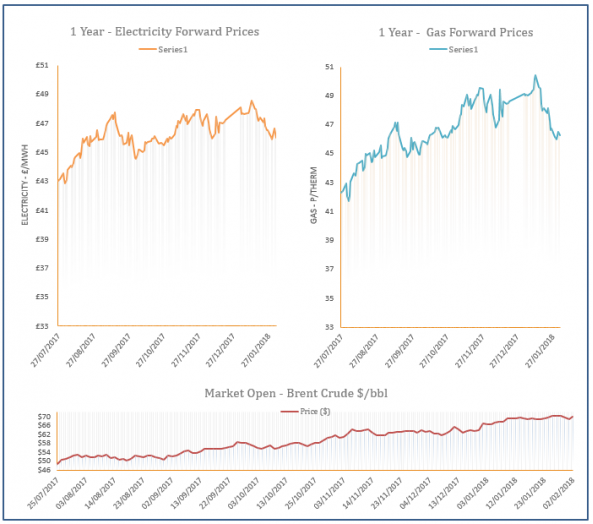
Energy Market Analysis - 02-02-2018
2nd February 2018 | Posted by: Daniel Birkett | Market Analysis
The short-term weather forecast points to colder temperatures over the weekend and the start of next week which helped towards gains at the front of the gas curve on Thursday. Brent and coal markets stabilised somewhat but the majority of far-curve prices still climbed higher.

Gas production needs be significantly reduced at Groningen
1st February 2018 | Posted by: Daniel Birkett | Industry News
It has been recommended that production at the Groningen gas facility be reduced significantly to ensure the safety of local residents following earthquakes.
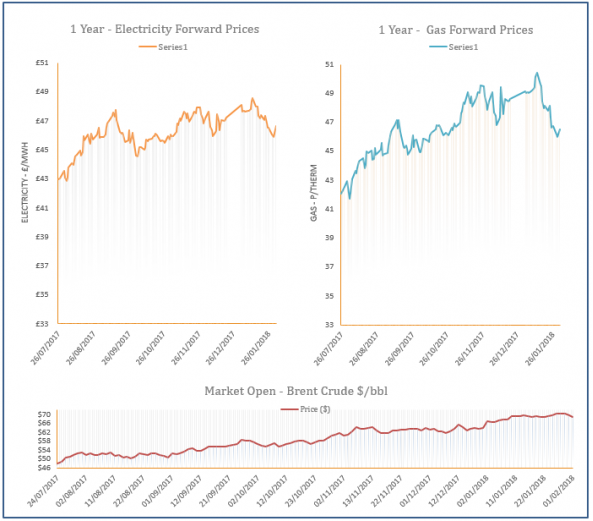
Energy Market Analysis - 01-02-2018
1st February 2018 | Posted by: Daniel Birkett | Market Analysis
A downward revision in temperatures for the next 7 days helped towards some increases on the near-curve yesterday. The upward movement was limited by strong wind levels which reduced CCGT demand and resulted in an oversupplied system. Meanwhile, coal shed from its price and oil stabilised, restricting gains at the back of the curve.