


Apollo Energy publishes a daily energy market analysis, focusing on the gas, power and oil markets including a commentary on how the markets close and open. Our analysis provides insight on how the markets are performing and also considers various factors which could dictate price changes in the future.
The analysis also contains a graph which tracks the one-year forward price of both gas and electricity as well as changes to Brent crude oil.
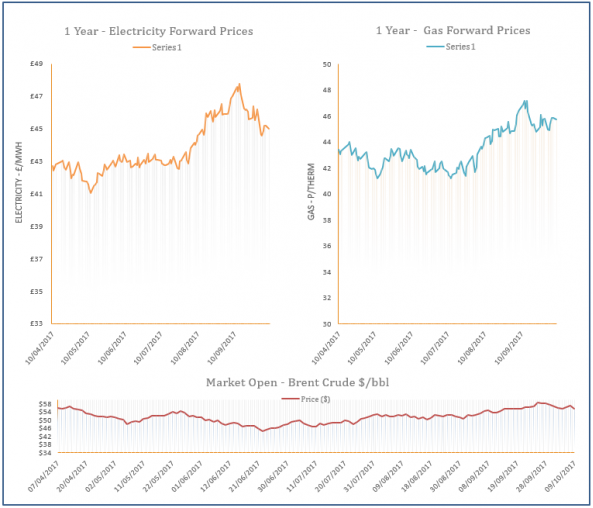
Energy Market Analysis - 09-10-2017
9th October 2017 | Posted by: Daniel Birkett | Market Analysis
The ongoing outage at the Corrib gas field in Ireland continued to increase UK exports, providing support to the near-curve despite an oversupplied system. Planned maintenance in Norway is also scheduled for tomorrow and Wednesday, adding to the bullish sentiment. Further out, a weakening Pound was offset by a drop in coal prices, resulting in some losses.
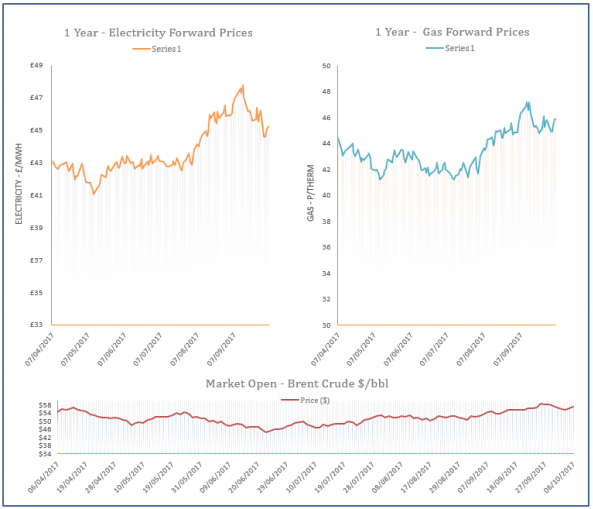
Energy Market Analysis - 06-10-2017
6th October 2017 | Posted by: Daniel Birkett | Market Analysis
Planned outages in Norway will restrict imports between the 10-12th of October, while unplanned outages affected Heimdal and Entry Segal, helping to lift prices on Thursday. Oil prices also recorded further gains which supported the far-curve, while the Pound continued to weaken against the Euro.

Energy price cap legislation to be passed
6th October 2017 | Posted by: Daniel Birkett | Industry News
Theresa May has announced the government’s intention to move forward with its plans to cap energy prices.
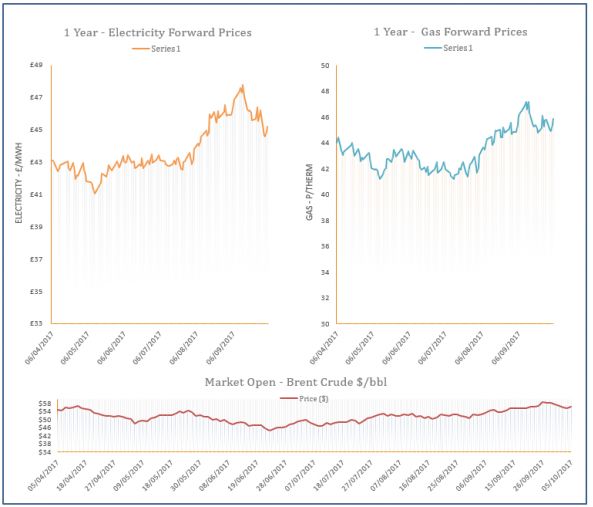
Energy Market Analysis - 05-10-2017
5th October 2017 | Posted by: Daniel Birkett | Market Analysis
Gas contracts stabilised on Wednesday as improved Norwegian flows offset the effects of a higher demand forecast, while storage withdrawals at Rough also resumed ahead of schedule. However, the back of the curve found support from a strong rise in coal prices due to worker strikes in Australia.
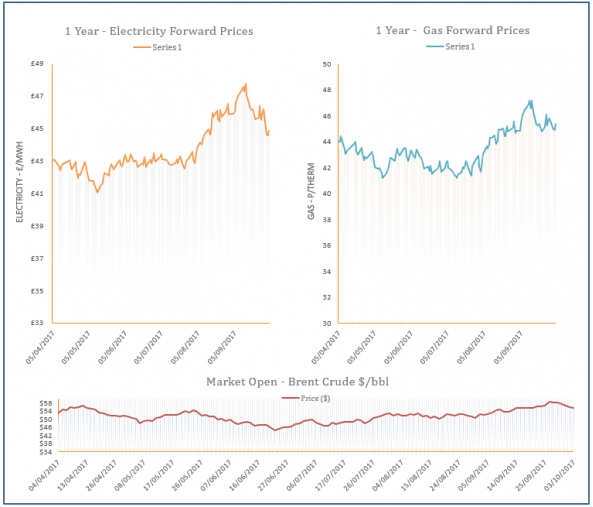
Energy Market Analysis - 04-10-2017
4th October 2017 | Posted by: Daniel Birkett | Market Analysis
CCGT generation was down yesterday but colder weather is expected to lift residential demand for the rest of the week, resulting in gains on the near gas curve. On the supply front, the system opened slightly long due to a rise in LNG flows following deliveries at Dragon and the Isle of Grain. Meanwhile, prices on the far-curve were stable-to-bearish as a result of weaker Brent.