


Apollo Energy publishes a daily energy market analysis, focusing on the gas, power and oil markets including a commentary on how the markets close and open. Our analysis provides insight on how the markets are performing and also considers various factors which could dictate price changes in the future.
The analysis also contains a graph which tracks the one-year forward price of both gas and electricity as well as changes to Brent crude oil.
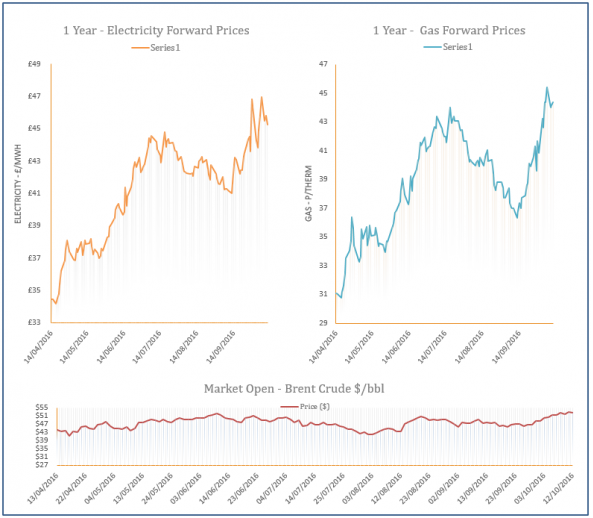
Energy Market Analysis - 12-10-2016
12th October 2016 | Posted by: Daniel Birkett | Market Analysis
Oil prices decreased yesterday which transferred to some contracts on the gas market, with a milder weather forecast also a bearish factor. Meanwhile, cold weather resulted in a rise in demand levels which sat 18% above the seasonal norm, while outages at gas facilities in Norway were ongoing, helping to lift the prompt.
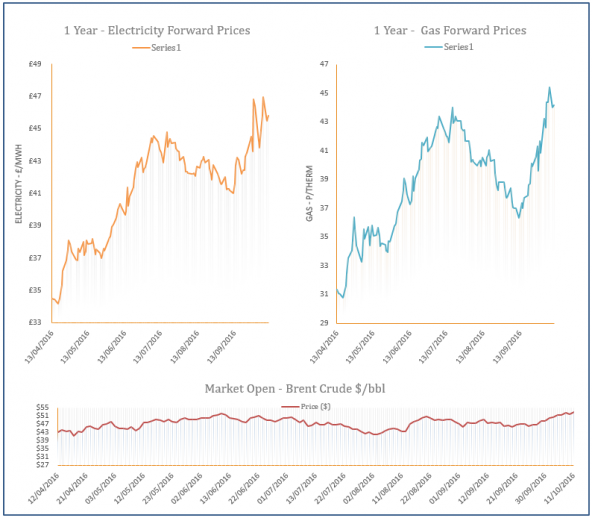
Energy Market Analysis - 11-10-2016
11th October 2016 | Posted by: Natalie Ormrod | Market Analysis
Gas prices were volatile once again yesterday, pressured by an upward revision in temperature forecasts for next week and strong flows from Norway. Rising oil prices also offered support. Curve contracts remained negative at the close, while spot prices showed some resilience amid short-term lower temperature forecasts.

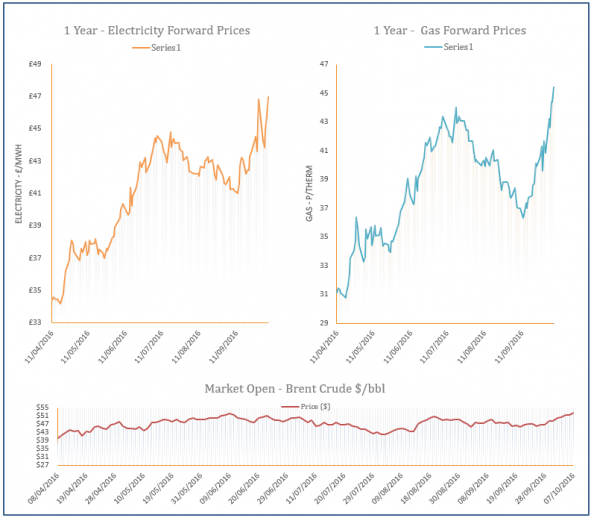
Energy Market Analysis - 10-10-2016
10th October 2016 | Posted by: Daniel Birkett | Market Analysis
Gas prices displayed losses on Friday and erased some of the gains recorded in previous sessions. Contracts were pressured down by decreases on the coal, power and oil markets despite another drop in Pound. Elsewhere, the worker’s strike at the Nyhamna gas plant in Norway was avoided but two unplanned outages reduced imports into the UK and restricted some of the downward movement.
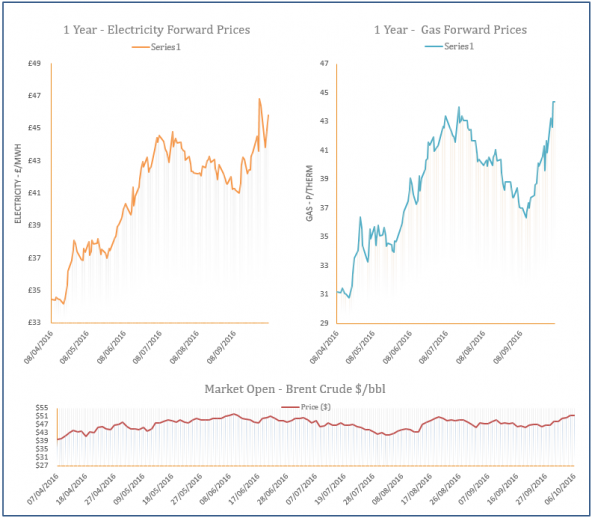
Energy Market Analysis - 07-10-2016
7th October 2016 | Posted by: Daniel Birkett | Market Analysis
Gas prices moved higher on Thursday with support coming from a potential worker’s strike at the Nyhamna gas plant in Norway which could impact supply levels. LNG send-outs were weaker in the UK, with a colder weather outlook also a bullish factor. Further out, prices were influenced by stronger coal, oil and power contracts, as well as a weaker Pound.
Energy Market Analysis - 06-10-2016
6th October 2016 | Posted by: Daniel Birkett | Market Analysis
Norwegian supply was reduced further yesterday which supported contracts on the near-curve, while rising oil continued to push far-curve prices higher. Gas demand is also expected to increase across Europe due to colder temperatures which provided further bullish pressure, as did another drop in the Pound.