Apollo Energy publishes a daily energy market analysis, focusing on the gas, power and oil markets including a commentary on how the markets close and open. Our analysis provides insight on how the markets are performing and also considers various factors which could dictate price changes in the future.
The analysis also contains a graph which tracks the one-year forward price of both gas and electricity as well as changes to Brent crude oil.
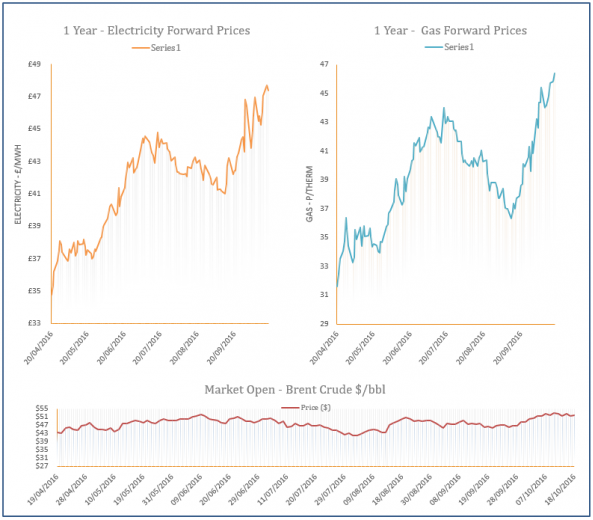
Energy Market Analysis - 18-10-2016
18th October 2016 | Posted by: Daniel Birkett | Market Analysis
Gas prices inched higher on Monday despite weakening Brent and a long UK gas system, with a colder weather outlook and stronger coal the main market drivers. Output at South Hook temporarily dropped to zero in the afternoon due to an outage, with LNG supply expected to remain weak over the next fortnight due to a lack of deliveries.
UK set for diesel generation boom?
18th October 2016 | Posted by: Daniel Birkett | Industry News
The UK’s diesel power sector could be set undergo a major expansion after 246 new projects qualified for subsidies via the government’s Capacity Market scheme. If approved, the combined capacity of the projects could potentially exceed that of the Hinkley Point nuclear power plant.
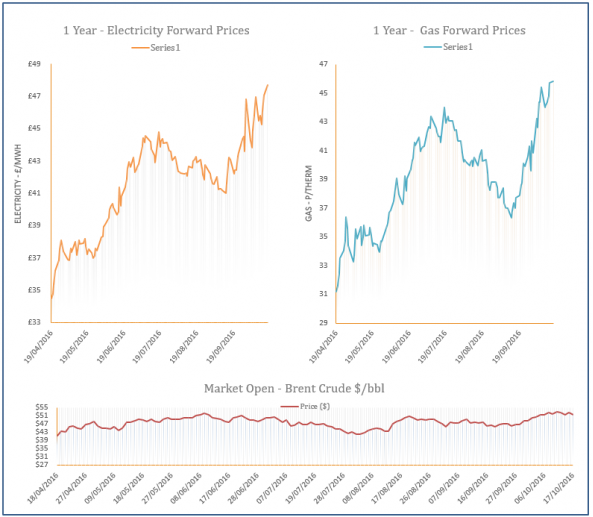
Energy Market Analysis - 17-10-2016
17th October 2016 | Posted by: Daniel Birkett | Market Analysis
Gas prices moved higher on Friday with direction coming from an expected drop in temperatures and weak LNG send-outs. LNG flows have been weak throughout October due to a lack of deliveries from Qatar, while a drop in UK storage also offered support to winter contracts. A below average demand forecast for the weekend and today helped to limit gains on the prompt, while rising coal and oil pushed far-curve contracts higher.
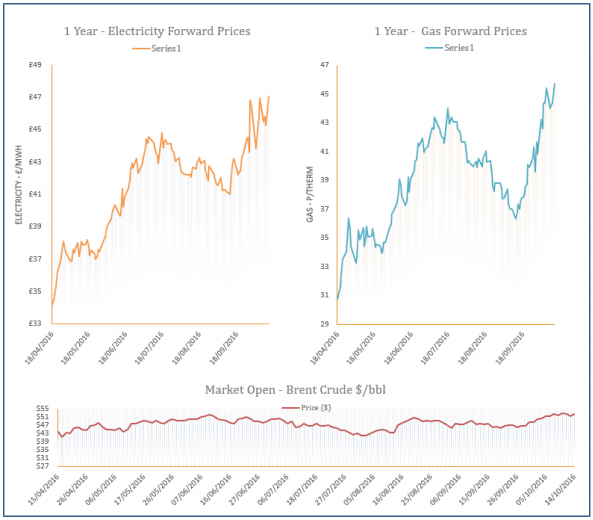
Energy Market Analysis - 14-10-2016
14th October 2016 | Posted by: Daniel Birkett | Market Analysis
Gas prices increased on Thursday despite stable fundamentals, with a lack of deliveries from Qatar this month resulting in weak LNG send-outs. Temperatures are also forecast to turn colder next week which helped to support prices at the front of the curve. Meanwhile, increases on the coal and oil markets helped towards gains on the far-curve.
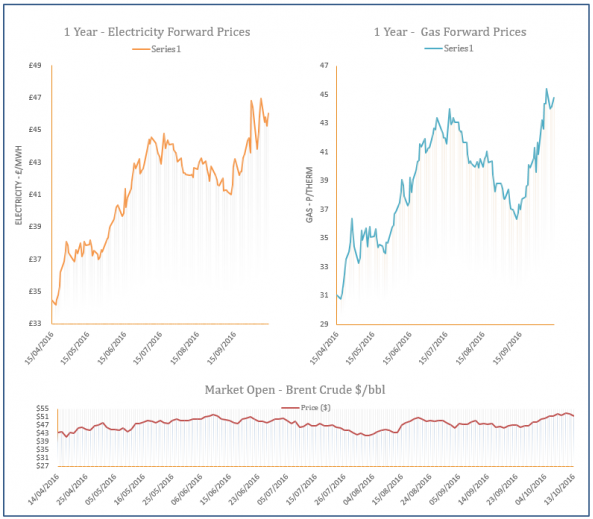
Energy Market Analysis - 13-10-2016
13th October 2016 | Posted by: Daniel Birkett | Market Analysis
Milder temperatures and an improved supply picture helped near-curve gas contracts move down on Wednesday, while falling oil prices helped to weigh on the far-curve. Early morning gains were cancelled out in the afternoon, with a rise in imports via the BBL pipeline and weaker demand resulting in an oversupplied system.


