


Apollo Energy publishes a daily energy market analysis, focusing on the gas, power and oil markets including a commentary on how the markets close and open. Our analysis provides insight on how the markets are performing and also considers various factors which could dictate price changes in the future.
The analysis also contains a graph which tracks the one-year forward price of both gas and electricity as well as changes to Brent crude oil.
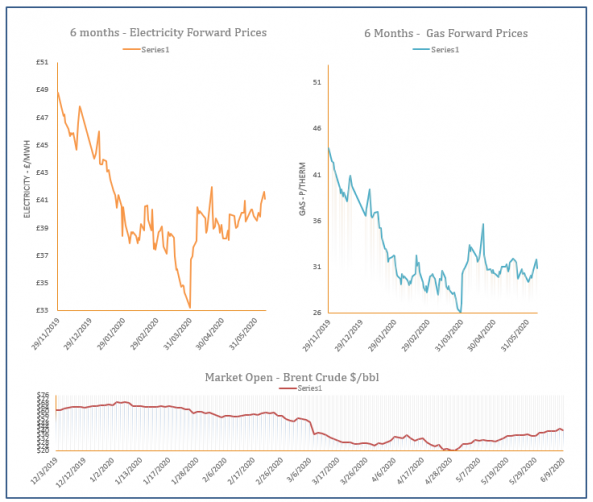
Energy Market Analysis – 09-06-2020
9th June 2020 | Posted by: Daniel Birkett | Market Analysis
Gas prices traded lower throughout Monday’s session with the help of an oversupplied system and a downward correction in oil. Coal, carbon and power markets also weakened in a bearish start to the week.

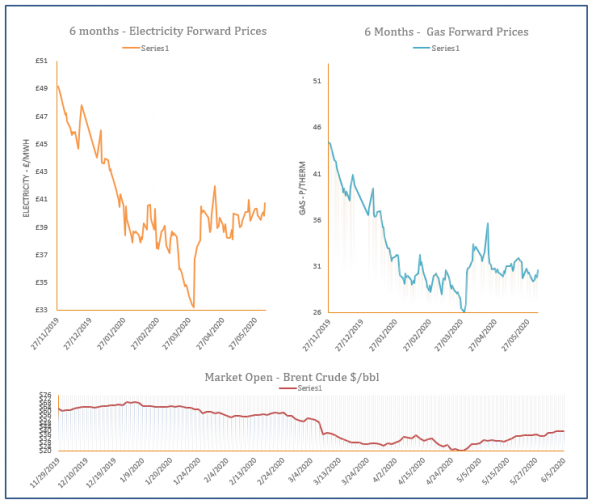
Energy Market Analysis – 08-06-2020
8th June 2020 | Posted by: Daniel Birkett | Market Analysis
Gas markets displayed strong gains on Friday, pushed higher by the broader commodity market and improving global equities. The likelihood of an extension to OPEC production cuts was the main market driver for UK gas.
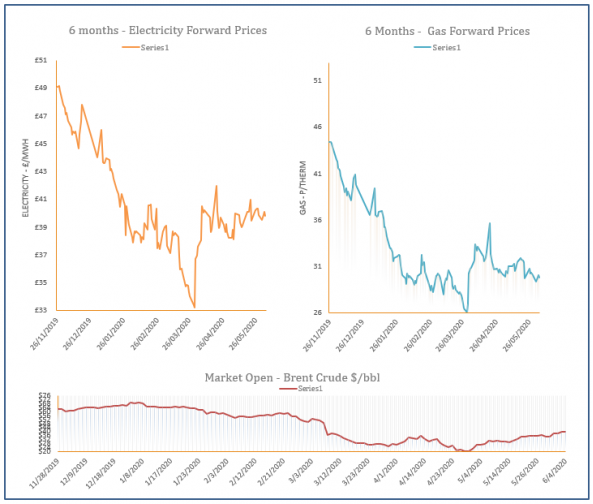
Energy Market Analysis – 05-06-2020
5th June 2020 | Posted by: Daniel Birkett | Market Analysis
Gas prices eased down towards the end of Thursday’s session, helped by a slight downward correction in oil. However, prices recovered a little in the afternoon, with some longer dated contracts closing in positive territory.
Energy Market Analysis – 04-06-2020
4th June 2020 | Posted by: Daniel Birkett | Market Analysis
Gas prices increased yesterday, with cooler weather lifting demand levels at a time when Norwegian supplies and LNG send-outs are reduced. The far-curve displayed minor gains on the back of a recovering oil market.

Energy Market Analysis – 03-06-2020
3rd June 2020 | Posted by: Daniel Birkett | Market Analysis
The UK gas system was undersupplied yesterday which resulted in gains at the front of the curve. Further out, prices found support from a rise in equities and commodities as Brent surpassed the $40/b mark.