


Energy Market Analysis – 21-02-2019
21st February 2019 | Posted by: Daniel Birkett | Market Analysis
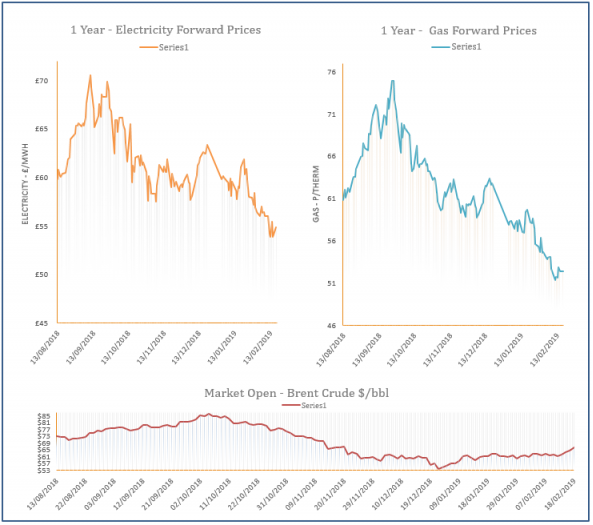
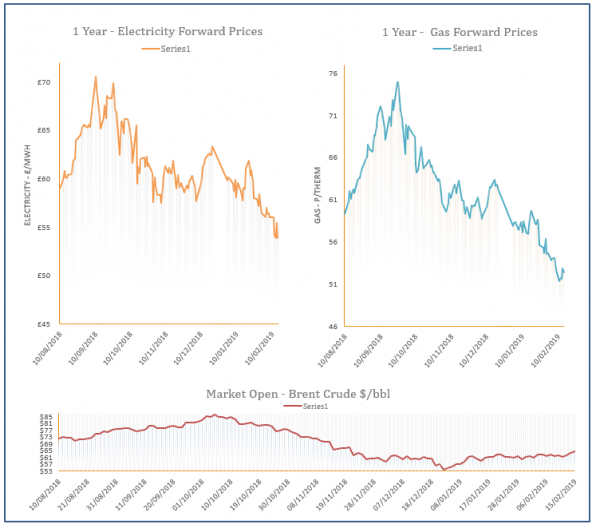
Gas prices were on the rise during Wednesday’s session as short sellers looked to leave their positions, causing a technical increase on gas markets. Oil, coal and carbon markets also moved higher, providing additional support.

Energy Market Analysis – 20-02-2019
20th February 2019 | Posted by: Daniel Birkett | Market Analysis
Gas prices were little changed during Tuesday’s session despite some support provided by a rise in coal and carbon. However, overall markets were stable and a healthy supply/ demand outlook for this week weighed on the near-curve.

Energy Market Analysis – 19-02-2019
19th February 2019 | Posted by: Daniel Birkett | Market Analysis
Gas prices moved down yesterday with direction coming from bearish European markets. A milder weather outlook also continued to weigh on the near-curve, with a flurry on LNG deliveries also a factor.
Energy Market Analysis – 18-02-2019
18th February 2019 | Posted by: Daniel Birkett | Market Analysis
Gas prices increased on Friday, tracking the movement of coal, oil, power and carbon markets. However, overall fundamentals were bearish with healthy supply, comfortable storage levels and a mild weather outlook limiting gains at the front of the curve.
Energy Market Analysis – 15-02-2019
15th February 2019 | Posted by: Daniel Birkett | Market Analysis
Near-curve gas prices eased down, while the far-curve moved higher in the morning before gradually erasing the gains as the session progressed. Weakening on fuel markets helped towards the losses, in addition to a healthy/ supply demand picture.