


Energy Market Analysis – 07-02-2019
7th February 2019 | Posted by: Daniel Birkett | Market Analysis
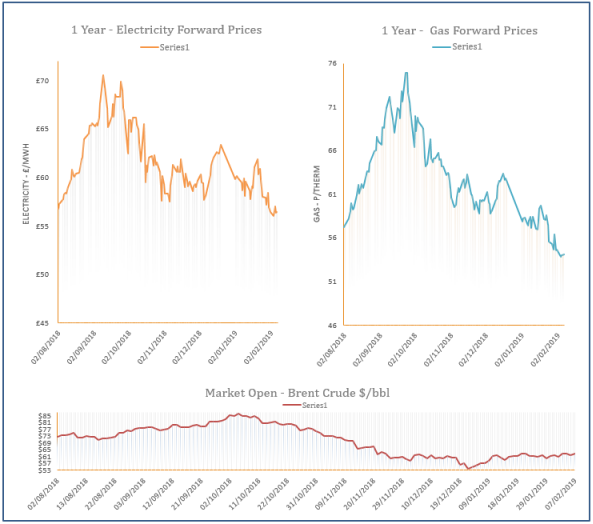
Gas prices eased down yesterday afternoon, with the larger decreases displayed at the front of the curve. Milder weather is expected this month and supply levels are healthy; Norwegian and Russian flows are strong, in addition to numerous LNG deliveries expected to dock in the next few weeks.

Energy Market Analysis – 06-02-2019
6th February 2019 | Posted by: Daniel Birkett | Market Analysis
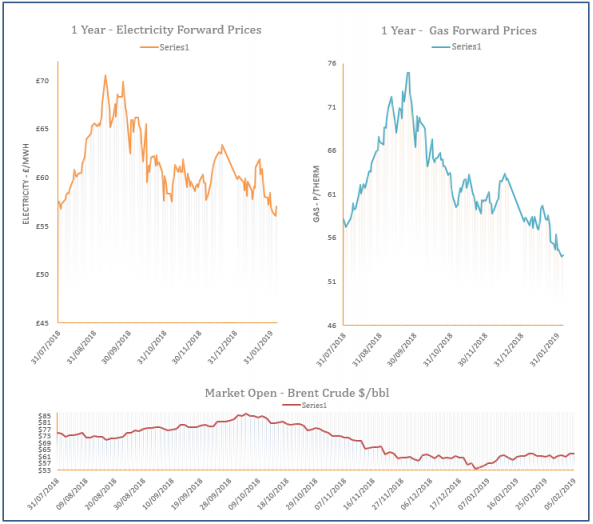
Gas prices were stable-to-bearish during yesterday’s session with fuel markets weakening further and the system close to balance. A drop in wind levels lifted CCGT demand which reduced available supply but a milder weather forecast limited the impact, with a busy LNG outlook also providing resistance.
Energy Market Analysis – 05-02-2019
5th February 2019 | Posted by: Daniel Birkett | Market Analysis
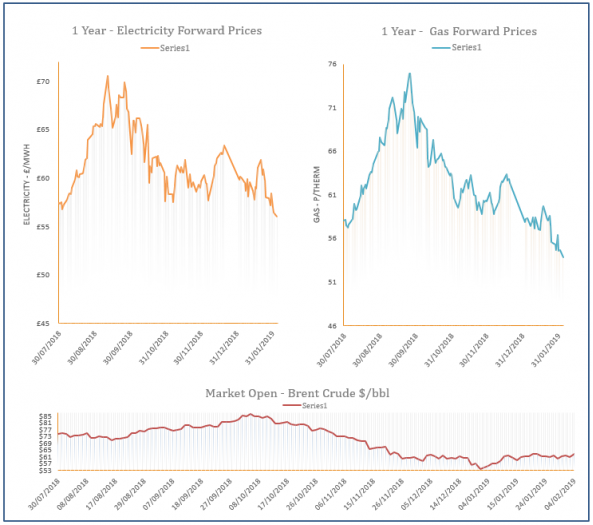
Gas prices were bearish yesterday, following weaker commodity markets with only oil displaying a gain. Supply levels were healthy and the system was oversupplied, helped by a drop in demand.
Energy Market Analysis – 04-02-2019
4th February 2019 | Posted by: Daniel Birkett | Market Analysis
Gas prices moved down on Friday with bearish pressure provided by a warmer weather outlook and healthy supply. The UK gas system was 20mcm long for most of the day despite higher residential demand. Fuel markets were also stable-to-bearish, helping to weigh on the far-curve.

Energy Market Analysis – 01-02-2019
1st February 2019 | Posted by: Daniel Birkett | Market Analysis
Gas prices moved down on Thursday as overall fundamentals were bearish despite cold weather. Coal, power, carbon and oil markets decreased in Europe and supply levels were healthy, resulting in losses across the curve.