Energy Market Analysis – 28-02-2019
28th February 2019 | Posted by: Daniel Birkett | Market Analysis
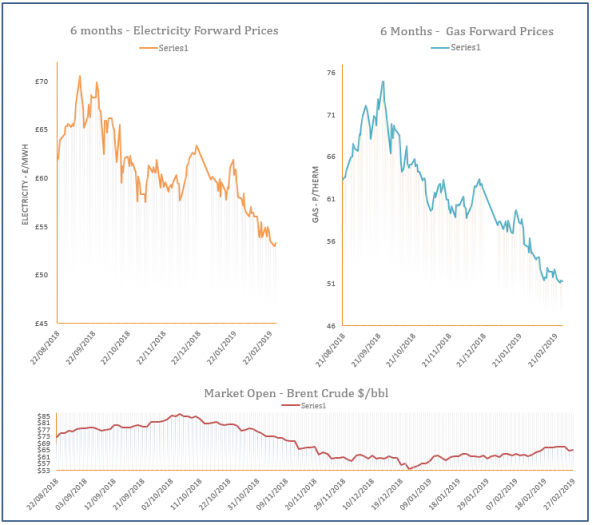
Gas prices increased throughout Wednesday’s session as the overall energy complex was bullish, with carbon markets in particular displaying large gains. Oil also rebounded, while a cooler weather outlook offered support to the front of the curve.
Energy Market Analysis – 27-02-2019
27th February 2019 | Posted by: Daniel Birkett | Market Analysis
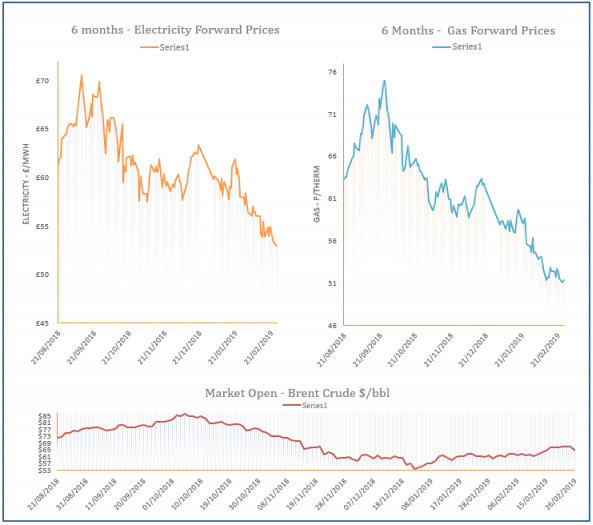
Gas prices displayed minor losses yesterday as the Pound strengthened against the Euro and the system was oversupplied. Movement on European markets was more mixed as coal, carbon, power and oil prices moved in different directions.
Energy Market Analysis – 26-02-2019
26th February 2019 | Posted by: Daniel Birkett | Market Analysis
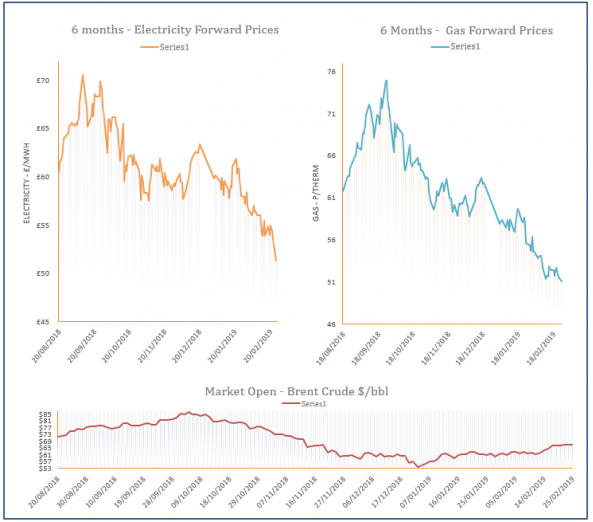
Gas prices moved down yesterday as fundamentals were bearish throughout the session. The system was oversupplied with mild weather expected to continue this week, while numerous LNG deliveries have boosted supply. Meanwhile, oil shed over $2/b from its price following comments from the US President.
Energy Market Analysis – 25-02-2019
25th February 2019 | Posted by: Daniel Birkett | Market Analysis
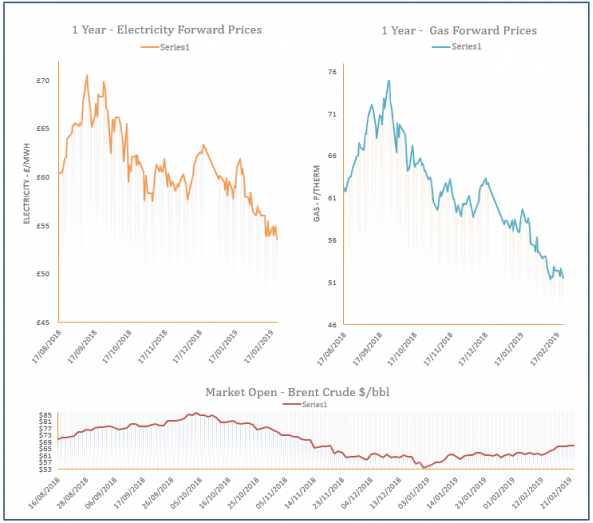
Gas prices moved lower on Friday, pressured down by movement on financial markets, a mild weather outlook and a flurry of LNG deliveries to the UK. The overall European energy complex was also bearish, resulting in losses on the far-curve.
Energy Market Analysis – 22-02-2019
22nd February 2019 | Posted by: Daniel Birkett | Market Analysis
Near-curve gas prices dipped yesterday thanks to an oversupplied system and a warm weather outlook; additional LNG cargoes are also expected to dock in the UK. Meanwhile, coal and carbon markets moved down and oil stabilised, weighing on the far-curve.


