


Energy Market Analysis – 14-02-2019
14th February 2019 | Posted by: Daniel Birkett | Market Analysis
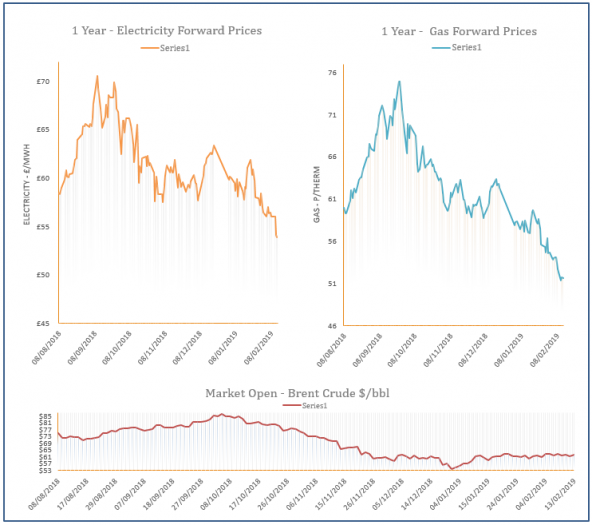
Gas prices increased yesterday afternoon, erasing early morning losses with direction coming from bullish coal, oil and carbon markets. However, upward movement at the front of the curve was capped by a milder weather outlook and comfortable supply.
Energy Market Analysis – 13-02-2019
13th February 2019 | Posted by: Daniel Birkett | Market Analysis
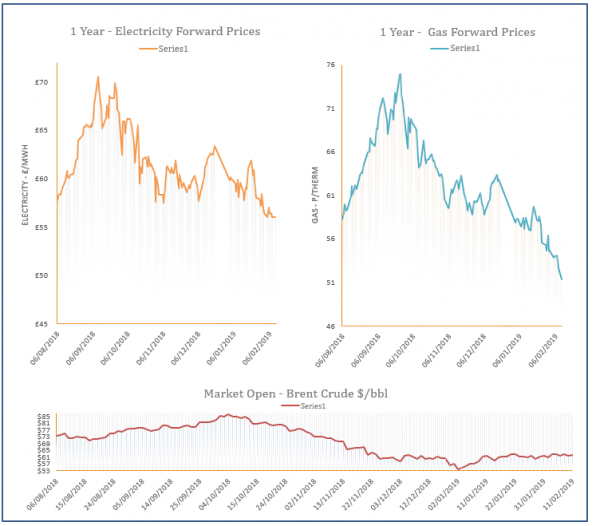
Gas prices displayed little movement yesterday with only minor changes displayed earlier in the session. Oil prices climbed higher, limiting any losses, while carbon moved in the opposite direction, creating mixed sentiment.

Energy Market Analysis – 12-02-2019
12th February 2019 | Posted by: Daniel Birkett | Market Analysis
Gas prices decreased yesterday with the stronger losses displayed at the front of the curve. Supply levels were healthy, offsetting a rise in demand, while the short term weather outlook is mild, contributing to the bearish sentiment.
Energy Market Analysis – 11-02-2019
11th February 2019 | Posted by: Daniel Birkett | Market Analysis
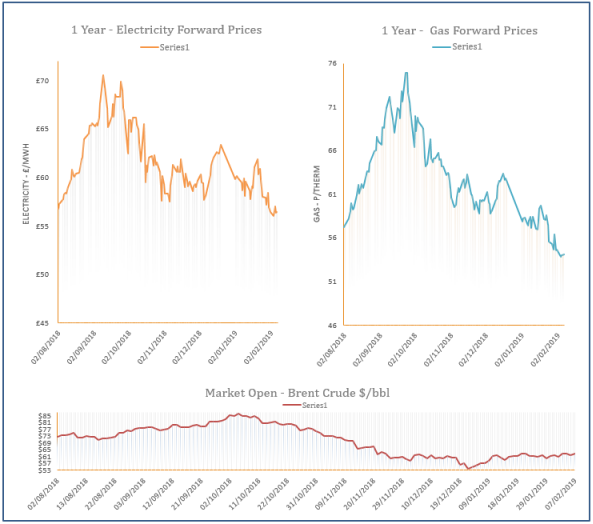
Near-curve gas prices moved down on Friday as supply levels were healthy and demand was down. Losses could also be observed further along the curve with direction coming from weaker coal and carbon.
Energy Market Analysis – 08-02-2019
8th February 2019 | Posted by: Daniel Birkett | Market Analysis
Gas prices were pressured down by a significant drop in coal yesterday, with oil and carbon markets also displaying a loss. Mild temperatures helped to weigh on the near-curve, although a drop in Dutch flows via the BBL pipeline limited losses on the prompt.