


Energy Market Analysis – 30-04-2020
30th April 2020 | Posted by: Daniel Birkett | Market Analysis
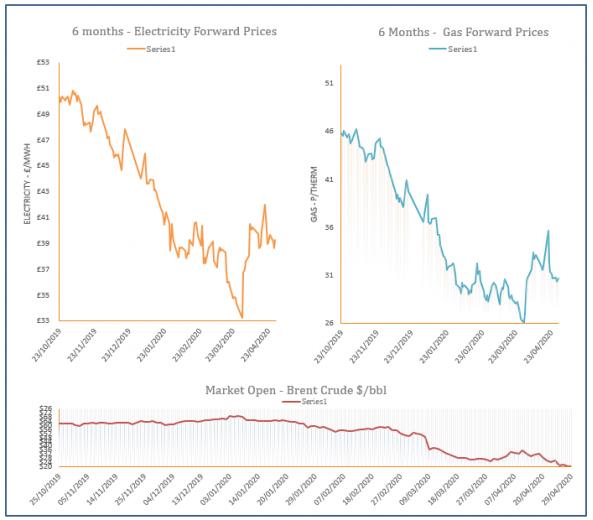
Gas prices decreased towards the end of Wednesday’s session to end the day at a discount. Prices ignored a rebound in oil and coal, although colder temperatures offered support to the prompt.
Energy Market Analysis – 29-04-2020
29th April 2020 | Posted by: Daniel Birkett | Market Analysis
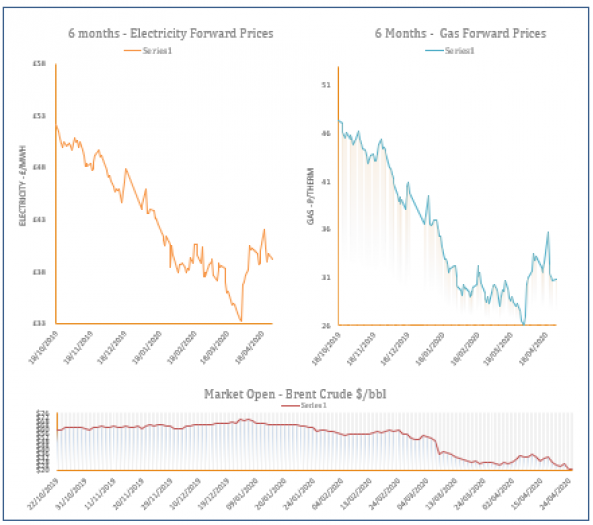
Gas prices moved higher at the front of the curve as demand has increased this week, partly down to cooler weather in the UK. Longer dated contracts remained bearish, taking direction from weaker oil and coal.

Energy Market Analysis – 28-04-2020
28th April 2020 | Posted by: Daniel Birkett | Market Analysis
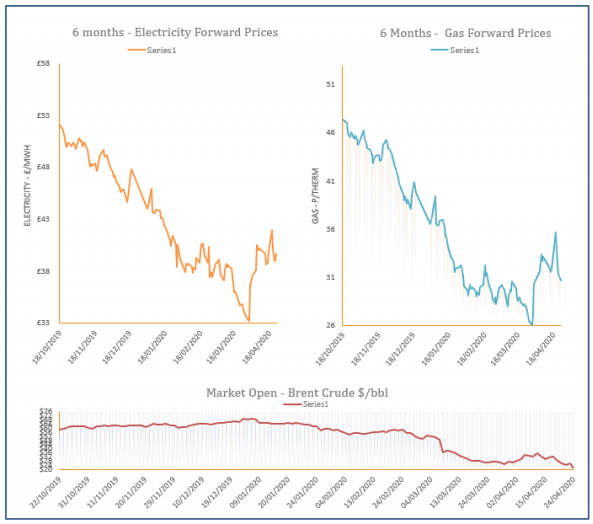
Gas prices saw a mixed day of trading yesterday as the front of the curve found some support from a rise in demand, while the far curve was pressured down by a drop in oil. Some bullish sentiment was also provided by expectations of a gradual lift on lockdowns in Europe next month.
Energy Market Analysis – 27-04-2020
27th April 2020 | Posted by: Lawrence Carson | Market Analysis
UK gas contracts followed the broader markets lower, along with coal, power and carbon credits. Conventional and LNG storages in the UK and Germany are between 70-75% full as demand remains impaired due to the COVID-19 shut-ins.
Energy Market Analysis – 24-04-2020
24th April 2020 | Posted by: Daniel Birkett | Market Analysis
Gas contracts continued to shed from their price on Thursday, with the larger losses displayed in the afternoon. Contracts were offered some support in the morning by a rise in oil but the front of the curve was dictated by healthy supply and storage levels.