


Apollo Energy publishes a daily energy market analysis, focusing on the gas, power and oil markets including a commentary on how the markets close and open. Our analysis provides insight on how the markets are performing and also considers various factors which could dictate price changes in the future.
The analysis also contains a graph which tracks the one-year forward price of both gas and electricity as well as changes to Brent crude oil.
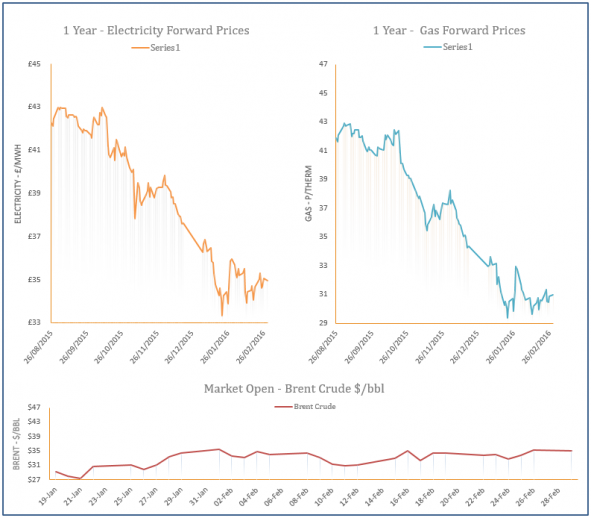
Energy Market Analysis - 29-02-2016
29th February 2016 | Posted by: Daniel Birkett | Market Analysis
Gas contracts moved higher on Friday with support coming from a rise in oil prices, although upward movement on the prompt was slightly restricted by a weaker demand outlook for this week. Supply levels were also comfortable with numerous LNG deliveries expected to arrive in the UK which helped to curb gains on the rest of the near-curve.
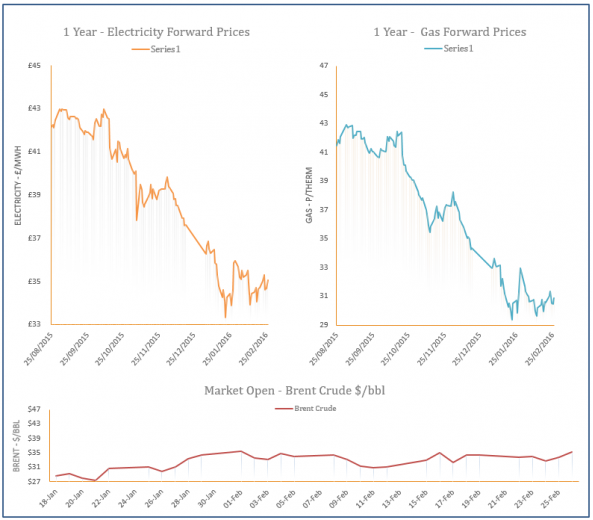
Energy Market Analysis - 26-02-2016
26th February 2016 | Posted by: Daniel Birkett | Market Analysis
Stronger demand levels in the UK, as a result of cold weather offered support to gas contracts yesterday but overall movement on the near-curve was bearish due to a healthy supply picture. Numerous LNG deliveries are expected to arrive in the UK next week which has led to increased send-outs, while flows from Europe also remained high. Further along the curve contracts took direction from rising Brent and posted gains.

The ESOS Compliance Deadline Has Passed
25th February 2016 | Posted by: Daniel Birkett | Industry News
A large number of companies who fall within the scope of ESOS have failed to comply ahead of the 29th January 2016 deadline. The deadline was extended in October 2015 but the Environment Agency (EA) has revealed that approximately 3,000 organisations have failed to take any action, while a further 1,000 companies have only registered an ‘intent to comply’.
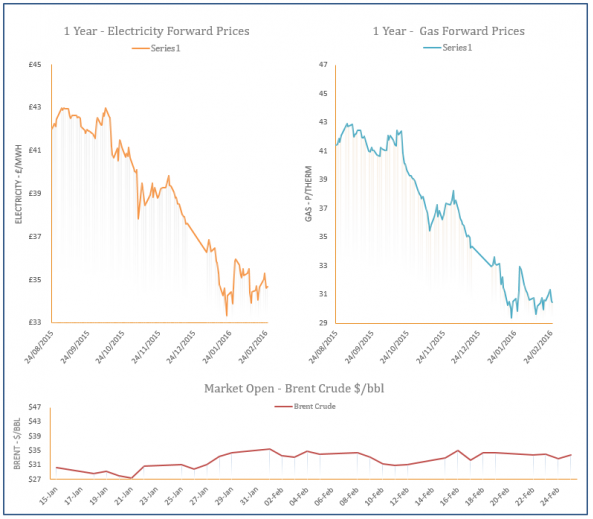
Energy Market Analysis - 25-02-2016
25th February 2016 | Posted by: Daniel Birkett | Market Analysis
Gas demand remained high yesterday as temperatures were below average, however, the gas system was oversupplied due to improved LNG send-outs. LNG flows rose from 41mcm to 57mcm with numerous deliveries expected to dock in the UK over the next week. Norwegian and Dutch imports into the UK were also higher and this healthy supply picture helped to weigh on contracts on the near-curve, with a drop in oil weighing on far-curve prices.
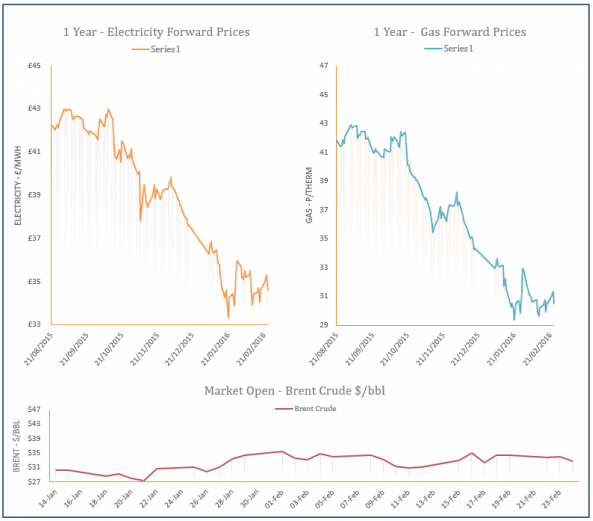
Energy Market Analysis - 24-02-2016
24th February 2016 | Posted by: Daniel Birkett | Market Analysis
A cold weather forecast for the rest of the week continued to apply bullish pressure to the gas curve yesterday with most contracts displaying a gain. However, supply levels remained comfortable despite rising demand which helped to limit the upward movement, with weaker oil also weighing on the far-curve.