


Apollo Energy publishes a daily energy market analysis, focusing on the gas, power and oil markets including a commentary on how the markets close and open. Our analysis provides insight on how the markets are performing and also considers various factors which could dictate price changes in the future.
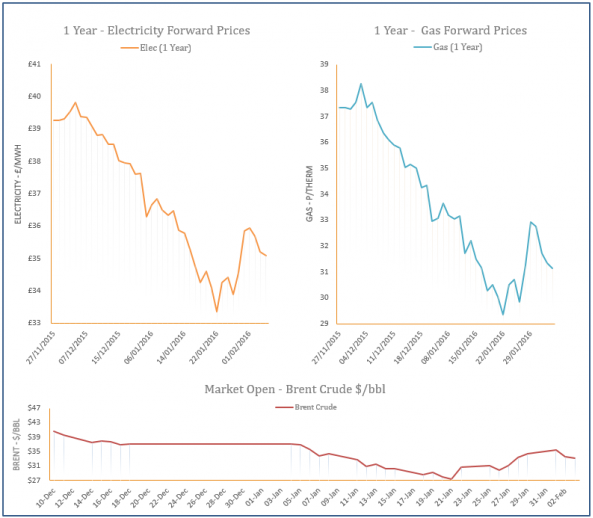
The analysis also contains a graph which tracks the one-year forward price of both gas and electricity as well as changes to Brent crude oil.
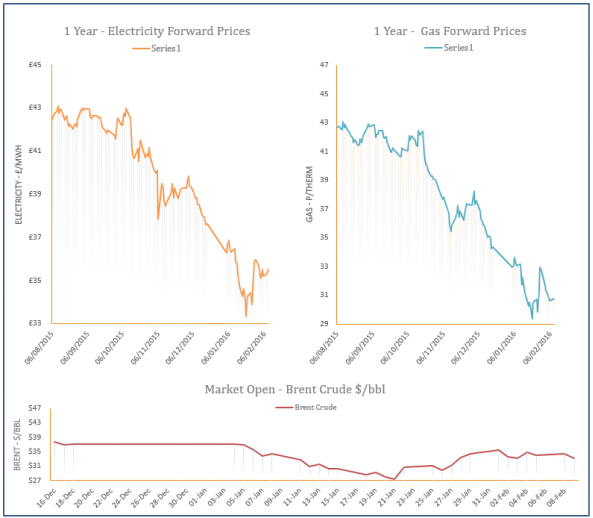
Energy Market Analysis - 09-02-2016
9th February 2016 | Posted by: Daniel Birkett | Market Analysis
The St Fergus terminal remained offline yesterday which limited flows into the UK, while demand levels also increased due to colder temperatures; this resulted in a gain for the prompt which filtered through to the rest of the near-curve. Further out, the sentiment was more bearish as contracts were influenced by weaker oil.
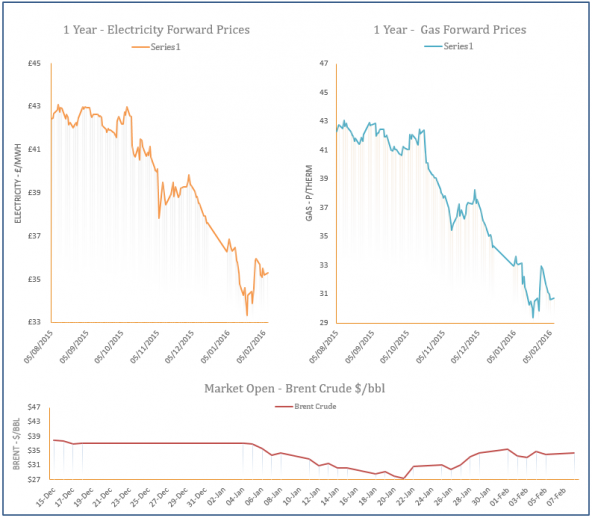
Energy Market Analysis - 08-02-2016
8th February 2016 | Posted by: Daniel Birkett | Market Analysis
Gas prices moved down on Friday as mild weather over the weekend reduced demand levels, with consumption falling to 6% below the seasonal average in the UK. However, an unplanned outage in Norway led to a halt in Langeled flows in the afternoon which restricted some of the downward movement on the near-curve. Further out, most contracts followed the movement of the weakening oil market.
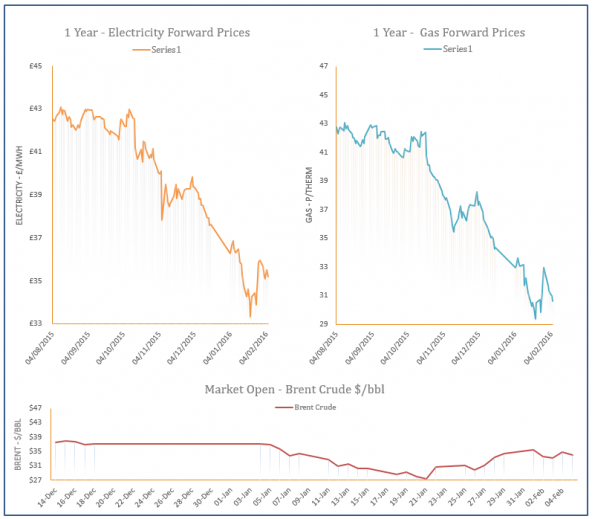
Energy Market Analysis - 05-02-2016
5th February 2016 | Posted by: Daniel Birkett | Market Analysis
Gas prices inched lower yesterday as demand levels fell, supply remained healthy and Brent weakened. The UK gas system was long throughout the session as Norwegian imports increased and LNG send-outs were strong. A further drop in demand was also forecast for today which further weighed on the prompt.
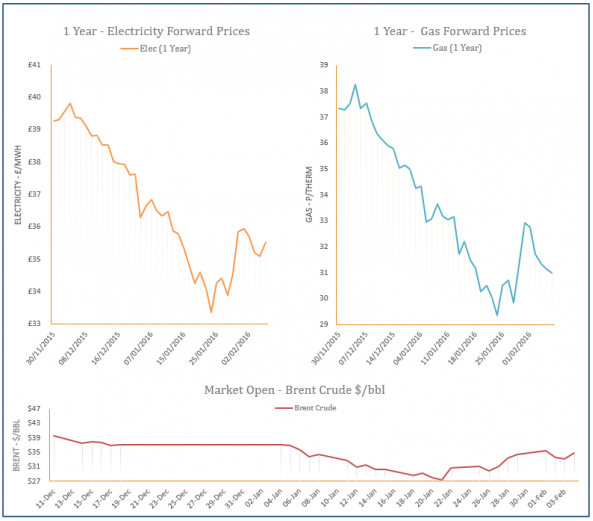
Energy Market Analysis - 04-02-2016
4th February 2016 | Posted by: Daniel Birkett | Market Analysis
Gas prices initially opened lower on Wednesday morning but upward movement on the oil market pushed contracts higher in the afternoon. However, the UK gas system was long throughout the session and demand levels were forecast to fall today which helped to weigh on the near-curve.
Energy Market Analysis - 03-02-2016
3rd February 2016 | Posted by: Daniel Birkett | Market Analysis
Falling oil continued to weigh on gas contracts across the curve on Tuesday, although a small rebound occurred in the afternoon. An 8mcm rise in demand levels restricted some of the losses on the near-curve despite a long gas system and a mild weather forecast for later in the week.